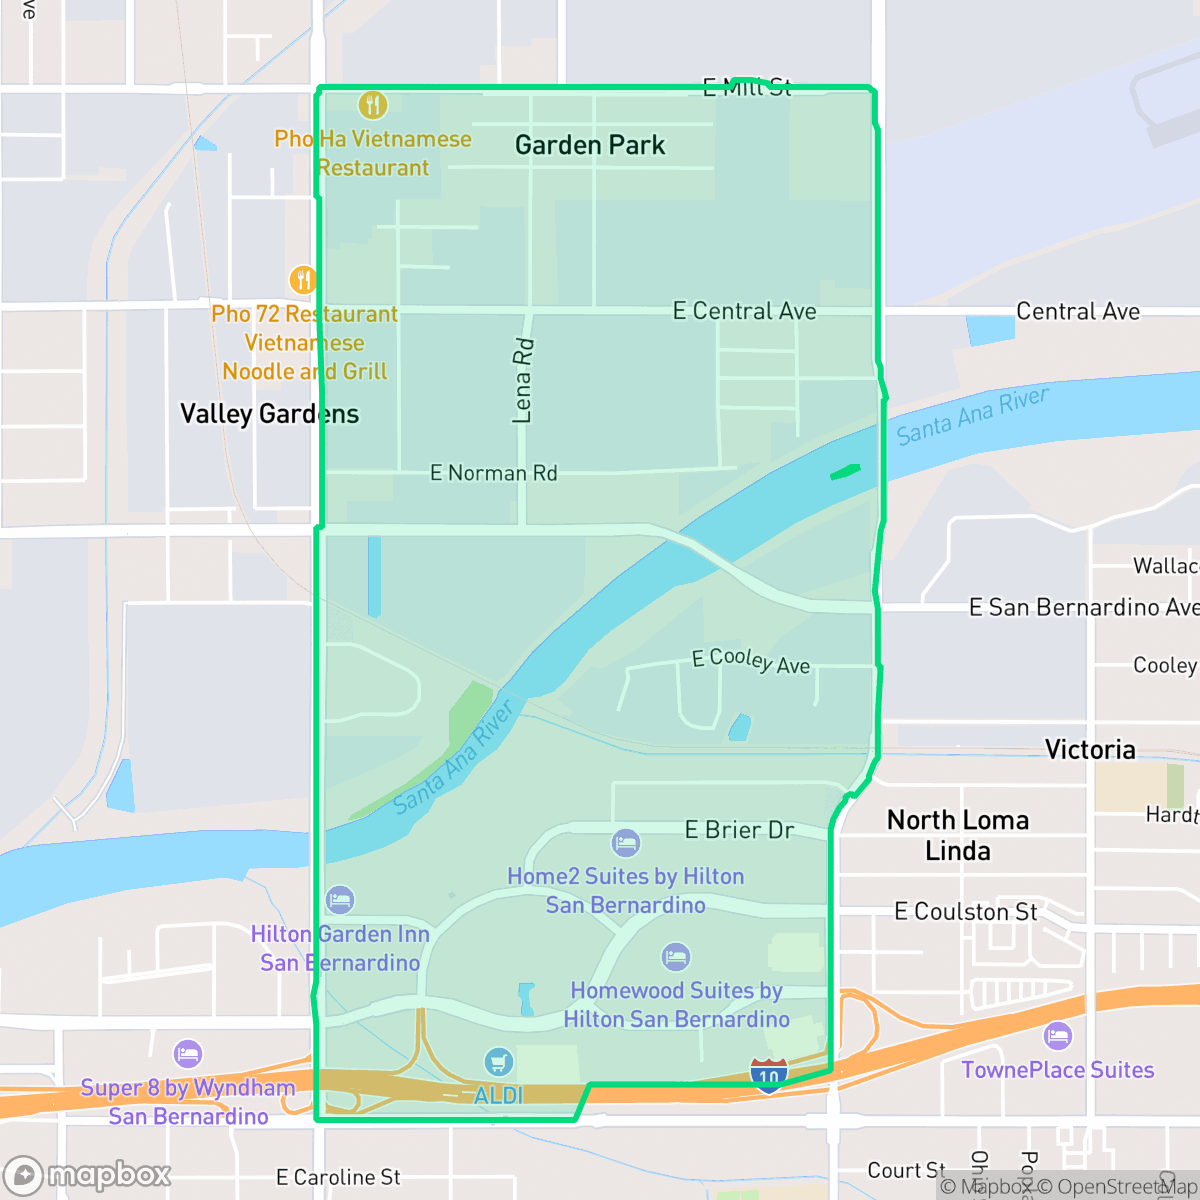
Valley View, San Bernardino
Updated June 22, 2026 · 1,892 residents
Valley View is an industrial-focused neighborhood in San Bernardino characterized by a dense landscape of large-scale logistics warehouses and freight corridors. The area is highly car-dependent with limited walkability and features a mix of suburban commercial hubs and quiet residential blocks.
Key Highlights
About Valley View
Valley View functions primarily as an industrial and logistics hub, defined by its proximity to major highways and a high concentration of large-scale warehousing facilities. The physical landscape is dominated by heavy vehicle traffic and expansive industrial footprints, which creates a distinct, utilitarian atmosphere. While the area includes pockets of suburban residential development and local dining options, it lacks a traditional pedestrian-friendly center, making vehicle ownership essential for daily commuting and accessing services. The neighborhood experiences elevated noise levels primarily due to consistent road traffic, though it maintains excellent air quality compared to the broader city average.
Living in the area involves significant trade-offs, particularly regarding acoustic comfort and daily convenience. The neighborhood is best suited for individuals who prioritize proximity to major logistics employment centers or those seeking straightforward access to regional transit routes. Residents should be aware of the industrial-heavy environment, which includes active freight corridors and limited green space. While the area offers stable access to essential services and educational districts, the overall lack of walkability and high industrial density suggest it is better suited for commuters than those seeking a quiet, pedestrian-oriented lifestyle.
Neighborhood Scores Across 15 Qualities
Residential spacing provides a moderate level of separation between neighbors, offering more buffer than the San Bernardino average. According to iHuus data, the area features mixed densities that balance community proximity with some degree of personal distance.
Limited sidewalk availability and high traffic volumes make pedestrian travel uncomfortable. This area is significantly less walkable than the San Bernardino average, according to iHuus data.
Standard tract housing dominates the landscape, featuring boxy rooflines and modest yards. This area offers less visual variety than the San Bernardino average, according to iHuus data.
Limited greenery and narrow verges make for few natural walking options for pets. According to iHuus data, the area offers significantly less pet-friendly infrastructure than the San Bernardino average.
Large-scale warehouses and logistics hubs characterize much of the area, though some pockets of scattered housing remain. This landscape is slightly more urbanized than the San Bernardino average due to significant industrial and commercial development.
Primarily composed of warehouses and freight corridors, this area offers a much lower level of social activity than the San Bernardino average. Most residents will find a quiet, car-dependent landscape with limited access to local dining or social destinations.
Frequent noise from nearby freight rail lines and major freeways defines the area. According to iHuus data, acoustic comfort in Valley View is notably lower than the San Bernardino average.
Air quality remains consistently high with minimal health concerns for residents. According to iHuus data, levels of atmospheric pollutants are notably lower than the San Bernardino city average.
Large logistics warehouses and heavy vehicle traffic are present alongside residential pockets; this level of industrial proximity is notably lower than the San Bernardino average. Residents may encounter significant freight movement and heavy truck activity near major distribution hubs and rail spurs.
Health insurance accessibility is lower in this area than in the rest of San Bernardino. According to iHuus data, a significant portion of the population lacks medical coverage.
Political leanings in this area lean liberal, though the community is slightly less progressive than the San Bernardino average according to iHuus data.
Residents live alongside a balanced mix of young adults, families, and seniors. This demographic distribution is consistent with the broader San Bernardino area according to iHuus data.
Flood risk levels in Valley View are higher than the San Bernardino average, though the area lacks a detailed FEMA flood study. According to iHuus data, the risk remains at an undetermined level.
Fire safety conditions in this area are significantly lower than the San Bernardino average. Residents should be aware of heightened vulnerability to fire hazards according to iHuus data.
Block-Level Insights for Valley View

iHuus Neighborhood Intelligence Insights
Get block-level neighborhood insights for Valley View
- Street-level scores — see how individual blocks compare, not just neighborhood averages
- Micro-zone boundaries — identify quiet pockets, flood boundaries, and walkable clusters before you visit
- 15 dimensions in full — walkability, noise, air quality, school quality, insurance coverage, population age profile, urban/rural index, and more
- Boundary risk alerts — know if your address sits near a block boundary where scores drop, the kind of detail no listing will ever mention
- School insights — individual school ratings and insights, not just district-level data
- Compare before you commit — side-by-side data across neighborhoods, down to block precision
No credit card required
Compare with Any Neighborhood
| Dimension | Valley View | Alessandro |
|---|---|---|
| 🚶 Walkabilityavg 7.12 | ||
| 🔊 Acoustic Comfortavg 4.28 | ||
| 🤫 Privacy Indexavg 5.05 | ||
| 🎨 Visual Appealavg 5.64 | ||
| 🐕 Dog Friendlinessavg 5.15 | ||
| 🗺️ Urban-Rural Indexavg 6.67 | ||
| ✨ Neighborhood Vibeavg 4.38 | ||
| 🏥 Health Insurance Coverageavg 5.05 | ||
| 🌿 Air Qualityavg 9.16 | ||
| 🏭 Industrial Proximityavg 6.81 | ||
| 🌊 Flood Safetyavg 1.26 | ||
| 🗳️ Ideological Leanavg 8.58 | ||
| 👥 Population Age Profileavg 4.36 | ||
| 🔥 Fire Safetyavg 0.3 | ||
| 🏫 School Quality |
Valley View Rankings
School Districts Serving Valley View
Redlands Unified School District is a solid and stable organization characterized by elite-performing high schools and a strong reputation for academic rigor in the Inland Empire. While the district maintains financial stability and enjoys high community trust through successful bond measures and facility modernizations, it faces internal challenges regarding feeder school consistency, with significant performance disparities between its top-rated elementary schools and its struggling middle school programs. Nevertheless, its robust CTE pathways, prestigious music programs, and proactive safety initiatives position it as a top-tier choice for families, outperforming most neighboring districts despite regional economic pressures.
Schools
San Bernardino City Unified is a district in transition, characterized by a 'tale of two districts' where prestigious magnet programs and high-performing schools in the Highland area contrast sharply with a high volume of underperforming schools in impoverished sectors. While the district maintains financial stability through bond-funded facility upgrades and is aggressively expanding successful Career Technical Education (CTE) pathways, it is heavily burdened by significant safety concerns, teacher retention issues, and core math proficiency that lags state averages. The organization's health is currently moderate, buoyed by specialized successes but weighed down by systemic operational challenges and a portfolio where nearly one-third of the schools fall in the bottom tier of state ratings.
Schools
Colton Joint Unified School District is currently in a distressed state characterized by a sharp academic divide and significant performance gaps in its middle and elementary schools. While flagship institutions like Grand Terrace High School offer high graduation rates and specialized CTE pathways, the district-wide proficiency in core subjects remains critically low, and several schools are operating with 1/10 ratings. Operational health is hampered by aging infrastructure and community concerns over safety and administrative transparency, though efforts to modernize the bus fleet and maintain student engagement in extracurriculars provide a minor buffer against complete institutional decline.
Schools
School Insights for Valley View
Below average outcomes; significant attendance and academic challenges.
School Insights
See what's really behind every school rating near Valley View
- Individual school ratings — each school's own score with outcome context, not just a district average
- Enrollment & class size data — student-to-teacher ratio and how it compares to the state average
- Full demographics breakdown — ethnicity and gender composition for every school in the enrollment zone
- Every school in the district — all schools within the enrollment boundary ranked by rating, not just the closest one
- Grade levels & benchmarks — elementary through high school, with below/above state-average flags
No credit card required