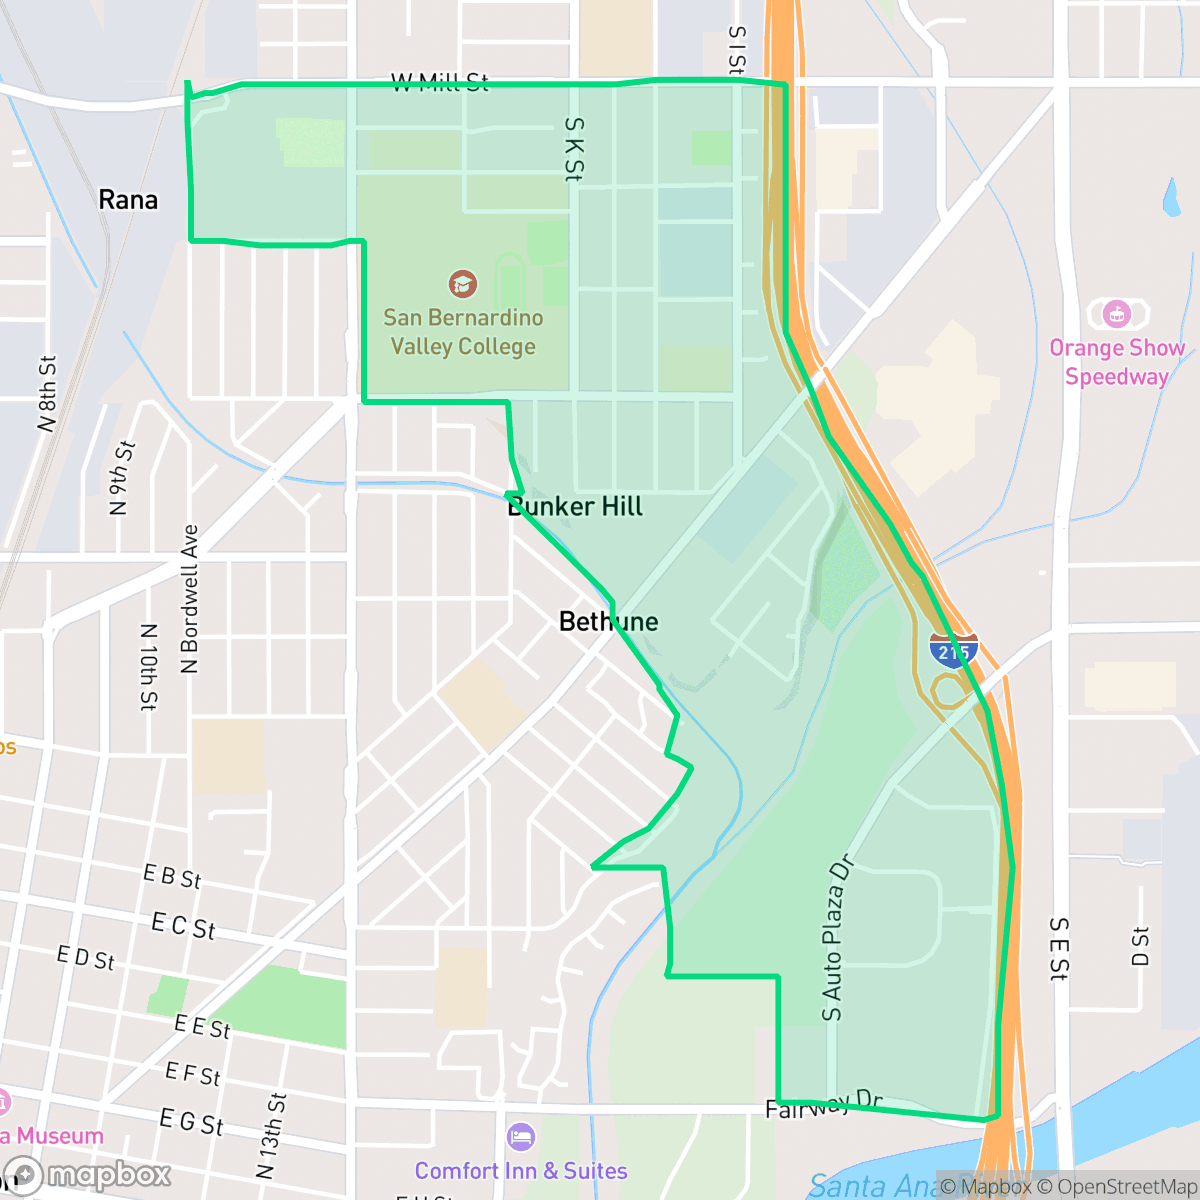
Valley College, San Bernardino
Updated June 22, 2026 · 3,561 residents
Valley College is a dense suburban neighborhood in San Bernardino characterized by a mix of residential grids and large-scale logistics facilities. While the area offers access to higher education and local services, it remains a car-dependent environment with modest housing footprints and limited private outdoor space.
Key Highlights
About Valley College
Located in San Bernardino, this neighborhood functions as a dense suburban enclave defined by its proximity to educational institutions and industrial logistics hubs. The architectural landscape consists primarily of tightly packed tract housing with limited space between structures, reflecting a high-density residential pattern. Residents benefit from access to local amenities and the presence of the college campus, which provides some of the few green spaces available in the immediate vicinity.
Living here involves certain trade-offs, particularly regarding acoustic comfort and privacy, as the area is influenced by road traffic and nearby industrial activity. While the neighborhood maintains excellent air quality, it is largely car-dependent due to the nature of the surrounding infrastructure. It is best suited for those who prioritize proximity to educational pathways like Middle College High and value a central location within the city over expansive private amenities or quiet, secluded streets.
Neighborhood Scores Across 15 Qualities
Residential lots feature closely spaced structures with minimal separation between homes. According to iHuus data, this density is notably higher than the San Bernardino average, resulting in less private buffer space between neighbors.
Sidewalks are consistently present along residential streets and main thoroughfares, offering better pedestrian connectivity than the San Bernardino average. Most areas feature a grid system with safe crossings, although large vacant lots and high-traffic industrial zones can occasionally interrupt the walking paths.
Residential views consist primarily of modest tract housing with small yards and functional, repetitive rooflines. This level of visual variety is roughly in line with the average for San Bernardino.
Public park access and green verges are sparse in residential areas, making this area slightly below the San Bernardino average for pet owners. While the nearby college campus provides some open space, sidewalks generally lack wide grassy strips for walking.
Frequent open land and scattered residential pockets exist alongside dense industrial zones and large-scale logistics hubs. This landscape is slightly less urban than the San Bernardino average, featuring a blend of institutional campus grounds and significant commercial infrastructure.
A blend of quiet residential blocks and industrial zones provides a moderate level of activity that is slightly higher than the San Bernardino average. While diverse dining and local services are present, many amenities remain car-dependent due to the proximity of warehouses and highways.
Steady sounds from nearby busy streets are common here. This level of acoustic activity is slightly higher than the average found throughout San Bernardino.
Air quality is consistently excellent with very little health concern. According to iHuus data, the air quality in this area is slightly better than the San Bernardino average.
Logistics hubs and active rail yards are located near residential zones, resulting in a level of industrial proximity that is slightly lower than the San Bernardino average. According to iHuus data, residents may experience increased heavy vehicle traffic and noise from nearby warehouses and freeway corridors.
Health insurance coverage is notably lower here than the San Bernardino city average. According to iHuus data, a small portion of the resident population maintains active health coverage.
Voting patterns and census indicators reflect a strongly liberal leaning that is more pronounced than the San Bernardino city average, according to iHuus data.
A diverse range of age demographics resides here, representing a balance of young adults, families, and older residents that is largely consistent with the San Bernardino city average.
Flood vulnerability is notably high in this area, mirroring the risk levels seen across most of San Bernardino. Residents should anticipate significant considerations regarding flood preparedness and potentially elevated insurance premiums.
Block-Level Insights for Valley College

iHuus Neighborhood Intelligence Insights
Get block-level neighborhood insights for Valley College
- Street-level scores — see how individual blocks compare, not just neighborhood averages
- Micro-zone boundaries — identify quiet pockets, flood boundaries, and walkable clusters before you visit
- 15 dimensions in full — walkability, noise, air quality, school quality, insurance coverage, population age profile, urban/rural index, and more
- Boundary risk alerts — know if your address sits near a block boundary where scores drop, the kind of detail no listing will ever mention
- School insights — individual school ratings and insights, not just district-level data
- Compare before you commit — side-by-side data across neighborhoods, down to block precision
No credit card required
Compare with Any Neighborhood
| Dimension | Valley College | Alessandro |
|---|---|---|
| 🚶 Walkabilityavg 7.12 | ||
| 🔊 Acoustic Comfortavg 4.28 | ||
| 🤫 Privacy Indexavg 5.05 | ||
| 🎨 Visual Appealavg 5.64 | ||
| 🐕 Dog Friendlinessavg 5.15 | ||
| 🗺️ Urban-Rural Indexavg 6.67 | ||
| ✨ Neighborhood Vibeavg 4.38 | ||
| 🏥 Health Insurance Coverageavg 5.05 | ||
| 🌿 Air Qualityavg 9.16 | ||
| 🏭 Industrial Proximityavg 6.81 | ||
| 🌊 Flood Safetyavg 1.26 | ||
| 🗳️ Ideological Leanavg 8.58 | ||
| 👥 Population Age Profileavg 4.36 | ||
| 🔥 Fire Safetyavg 0.3 | ||
| 🏫 School Quality |
Valley College Rankings
School Districts Serving Valley College
San Bernardino City Unified is a district in transition, characterized by a 'tale of two districts' where prestigious magnet programs and high-performing schools in the Highland area contrast sharply with a high volume of underperforming schools in impoverished sectors. While the district maintains financial stability through bond-funded facility upgrades and is aggressively expanding successful Career Technical Education (CTE) pathways, it is heavily burdened by significant safety concerns, teacher retention issues, and core math proficiency that lags state averages. The organization's health is currently moderate, buoyed by specialized successes but weighed down by systemic operational challenges and a portfolio where nearly one-third of the schools fall in the bottom tier of state ratings.
Schools
Colton Joint Unified School District is currently in a distressed state characterized by a sharp academic divide and significant performance gaps in its middle and elementary schools. While flagship institutions like Grand Terrace High School offer high graduation rates and specialized CTE pathways, the district-wide proficiency in core subjects remains critically low, and several schools are operating with 1/10 ratings. Operational health is hampered by aging infrastructure and community concerns over safety and administrative transparency, though efforts to modernize the bus fleet and maintain student engagement in extracurriculars provide a minor buffer against complete institutional decline.
Schools
School Insights for Valley College
Below average outcomes; significant attendance and academic challenges.
School Insights
See what's really behind every school rating near Valley College
- Individual school ratings — each school's own score with outcome context, not just a district average
- Enrollment & class size data — student-to-teacher ratio and how it compares to the state average
- Full demographics breakdown — ethnicity and gender composition for every school in the enrollment zone
- Every school in the district — all schools within the enrollment boundary ranked by rating, not just the closest one
- Grade levels & benchmarks — elementary through high school, with below/above state-average flags
No credit card required