Show Place, San Bernardino
Updated June 22, 2026 · 1,167 residents
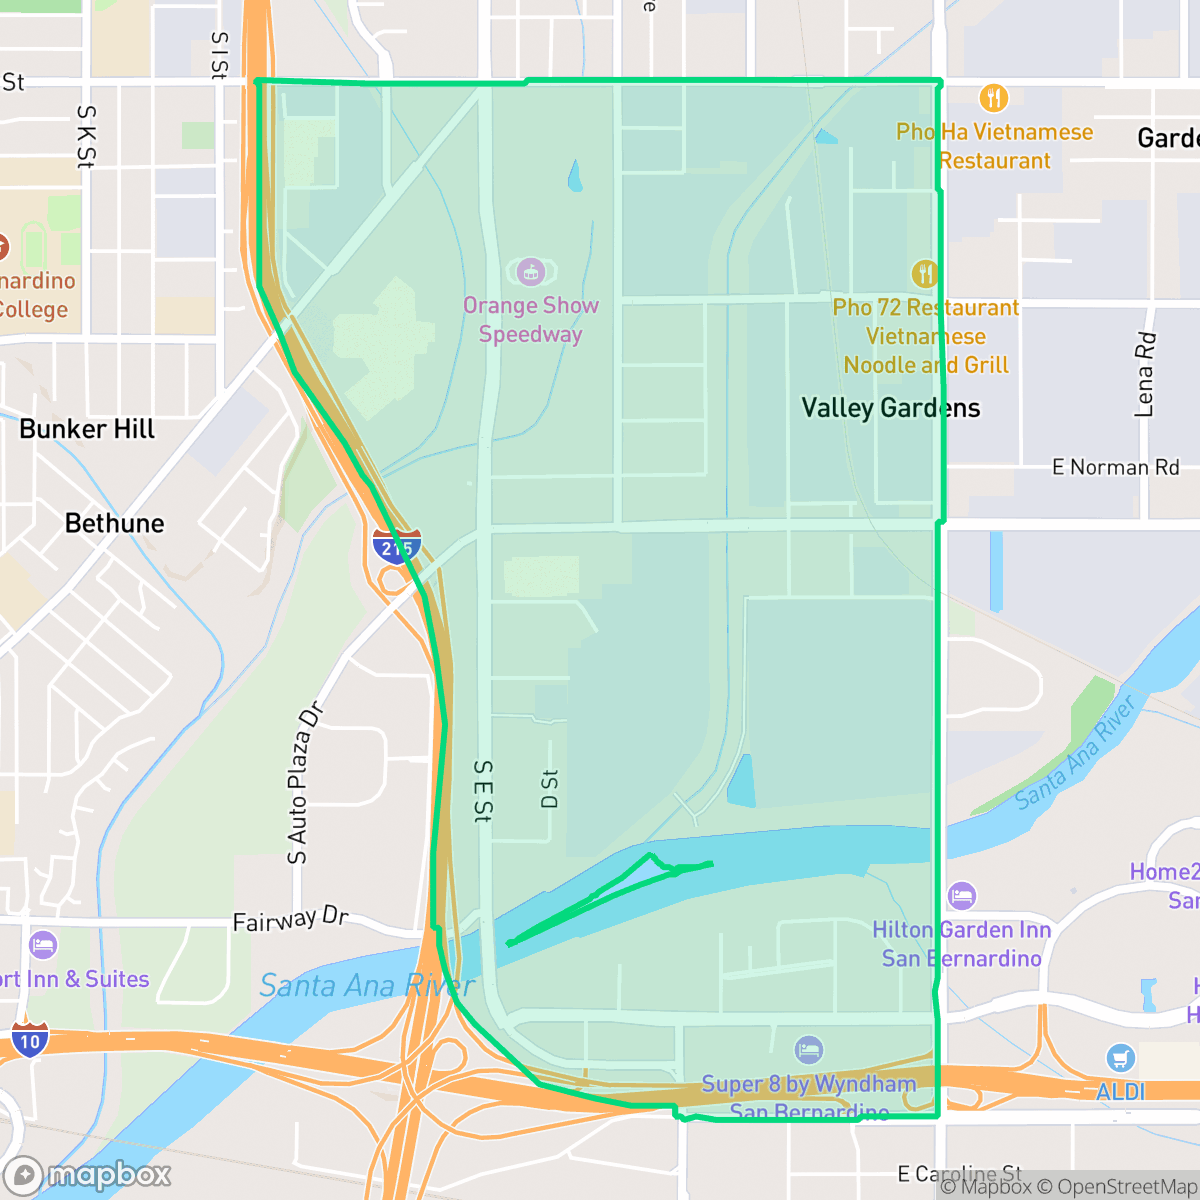
Show Place is an industrial-focused neighborhood in San Bernardino defined by its expansive logistics centers, warehouses, and proximity to major highway interchanges. While the area benefits from high air quality, it is characterized by limited walkability, significant road traffic noise, and a landscape dominated by heavy commercial infrastructure.
Key Highlights
About Show Place
Show Place functions primarily as a logistics and industrial hub within San Bernardino. The landscape is dominated by large-footprint warehouses, major logistics centers, and significant grey infrastructure, including a local wastewater treatment plant. Despite the heavy industrial presence, the area maintains a suburban feel in residential pockets with a mix of quiet streets and proximity to essential services and regional dining options. According to iHuus data, the neighborhood provides a distinct environment where industrial activity and suburban living intersect.
Living in this area requires a vehicle, as the neighborhood features very low walkability and limited dog-friendly amenities. Residents should be prepared for consistent road traffic noise and a high industrial presence. While the air quality is notably high, the neighborhood presents challenges regarding fire and flood safety, and schools in the surrounding districts show significant performance gaps. It is best suited for individuals who prioritize proximity to major transport routes and industrial employment hubs over traditional residential walkability.
Neighborhood Scores Across 15 Qualities
Residential spacing is varied, providing a slightly greater degree of separation between neighbors than is typical for San Bernardino. According to iHuus data, the area features a mix of density levels that offers some buffer between adjacent properties.
Limited sidewalk availability and high traffic volume make navigating the area on foot challenging. According to iHuus data, walkability in this neighborhood is significantly lower than the San Bernardino average.
Standard tract housing with boxy rooflines and small yards defines the area. Visual variety is lower than the San Bernardino average according to iHuus data.
Minimal greenery and narrow sidewalks make outdoor exercise difficult for pets. This area offers significantly fewer dog-friendly spaces than the San Bernardino average, according to iHuus data.
Industrial development and large-scale warehouse footprints dominate the landscape, creating a setting that is slightly more urbanized than the San Bernardino average. Residents will find a landscape characterized by significant grey infrastructure and heavy commercial zones interspersed with pockets of suburban housing.
Industrial landscapes and highway-adjacent warehouses define this area, creating a subdued atmosphere that is less lively than the San Bernardino average. While various dining options and essential services are available, the layout remains largely car-dependent with limited walkability.
Frequent noise from nearby freeways and railroad tracks makes this area significantly louder than the San Bernardino average. Residents should expect consistent auditory disturbances from heavy traffic and transit corridors.
Air quality is exceptionally high with minimal health concerns. According to iHuus data, the air remains cleaner here than the average for San Bernardino.
Large logistics warehouses, rail lines, and a wastewater treatment plant contribute to significant heavy vehicle traffic and industrial activity. This level of industrial presence is notably higher than the San Bernardino average, according to iHuus data.
Health insurance accessibility in this area is consistent with the broader San Bernardino average. According to iHuus data, residents face similar levels of coverage availability as the rest of the city.
Political leanings in Show Place are notably liberal, closely mirroring the broader political landscape found across San Bernardino.
Residents live alongside a balanced mix of young adults, families, and seniors. This demographic distribution is slightly more varied than the average found across San Bernardino, according to iHuus data.
Frequent flood risks exist due to the neighborhood's location within a 100-year floodplain; according to iHuus data, this area carries a higher risk level than the San Bernardino average.
Block-Level Insights for Show Place

iHuus Neighborhood Intelligence Insights
Get block-level neighborhood insights for Show Place
- Street-level scores — see how individual blocks compare, not just neighborhood averages
- Micro-zone boundaries — identify quiet pockets, flood boundaries, and walkable clusters before you visit
- 15 dimensions in full — walkability, noise, air quality, school quality, insurance coverage, population age profile, urban/rural index, and more
- Boundary risk alerts — know if your address sits near a block boundary where scores drop, the kind of detail no listing will ever mention
- School insights — individual school ratings and insights, not just district-level data
- Compare before you commit — side-by-side data across neighborhoods, down to block precision
No credit card required
Compare with Any Neighborhood
| Dimension | Show Place | Alessandro |
|---|---|---|
| 🚶 Walkabilityavg 7.12 | ||
| 🔊 Acoustic Comfortavg 4.28 | ||
| 🤫 Privacy Indexavg 5.05 | ||
| 🎨 Visual Appealavg 5.64 | ||
| 🐕 Dog Friendlinessavg 5.15 | ||
| 🗺️ Urban-Rural Indexavg 6.67 | ||
| ✨ Neighborhood Vibeavg 4.38 | ||
| 🏥 Health Insurance Coverageavg 5.05 | ||
| 🌿 Air Qualityavg 9.16 | ||
| 🏭 Industrial Proximityavg 6.81 | ||
| 🌊 Flood Safetyavg 1.26 | ||
| 🗳️ Ideological Leanavg 8.58 | ||
| 👥 Population Age Profileavg 4.36 | ||
| 🔥 Fire Safetyavg 0.3 | ||
| 🏫 School Quality |
Show Place Rankings
School Districts Serving Show Place
San Bernardino City Unified is a district in transition, characterized by a 'tale of two districts' where prestigious magnet programs and high-performing schools in the Highland area contrast sharply with a high volume of underperforming schools in impoverished sectors. While the district maintains financial stability through bond-funded facility upgrades and is aggressively expanding successful Career Technical Education (CTE) pathways, it is heavily burdened by significant safety concerns, teacher retention issues, and core math proficiency that lags state averages. The organization's health is currently moderate, buoyed by specialized successes but weighed down by systemic operational challenges and a portfolio where nearly one-third of the schools fall in the bottom tier of state ratings.
Schools
Colton Joint Unified School District is currently in a distressed state characterized by a sharp academic divide and significant performance gaps in its middle and elementary schools. While flagship institutions like Grand Terrace High School offer high graduation rates and specialized CTE pathways, the district-wide proficiency in core subjects remains critically low, and several schools are operating with 1/10 ratings. Operational health is hampered by aging infrastructure and community concerns over safety and administrative transparency, though efforts to modernize the bus fleet and maintain student engagement in extracurriculars provide a minor buffer against complete institutional decline.
Schools
School Insights for Show Place
Below average outcomes; significant attendance and academic challenges.
School Insights
See what's really behind every school rating near Show Place
- Individual school ratings — each school's own score with outcome context, not just a district average
- Enrollment & class size data — student-to-teacher ratio and how it compares to the state average
- Full demographics breakdown — ethnicity and gender composition for every school in the enrollment zone
- Every school in the district — all schools within the enrollment boundary ranked by rating, not just the closest one
- Grade levels & benchmarks — elementary through high school, with below/above state-average flags
No credit card required