Rancho West, San Bernardino
Updated June 22, 2026 · 11,782 residents
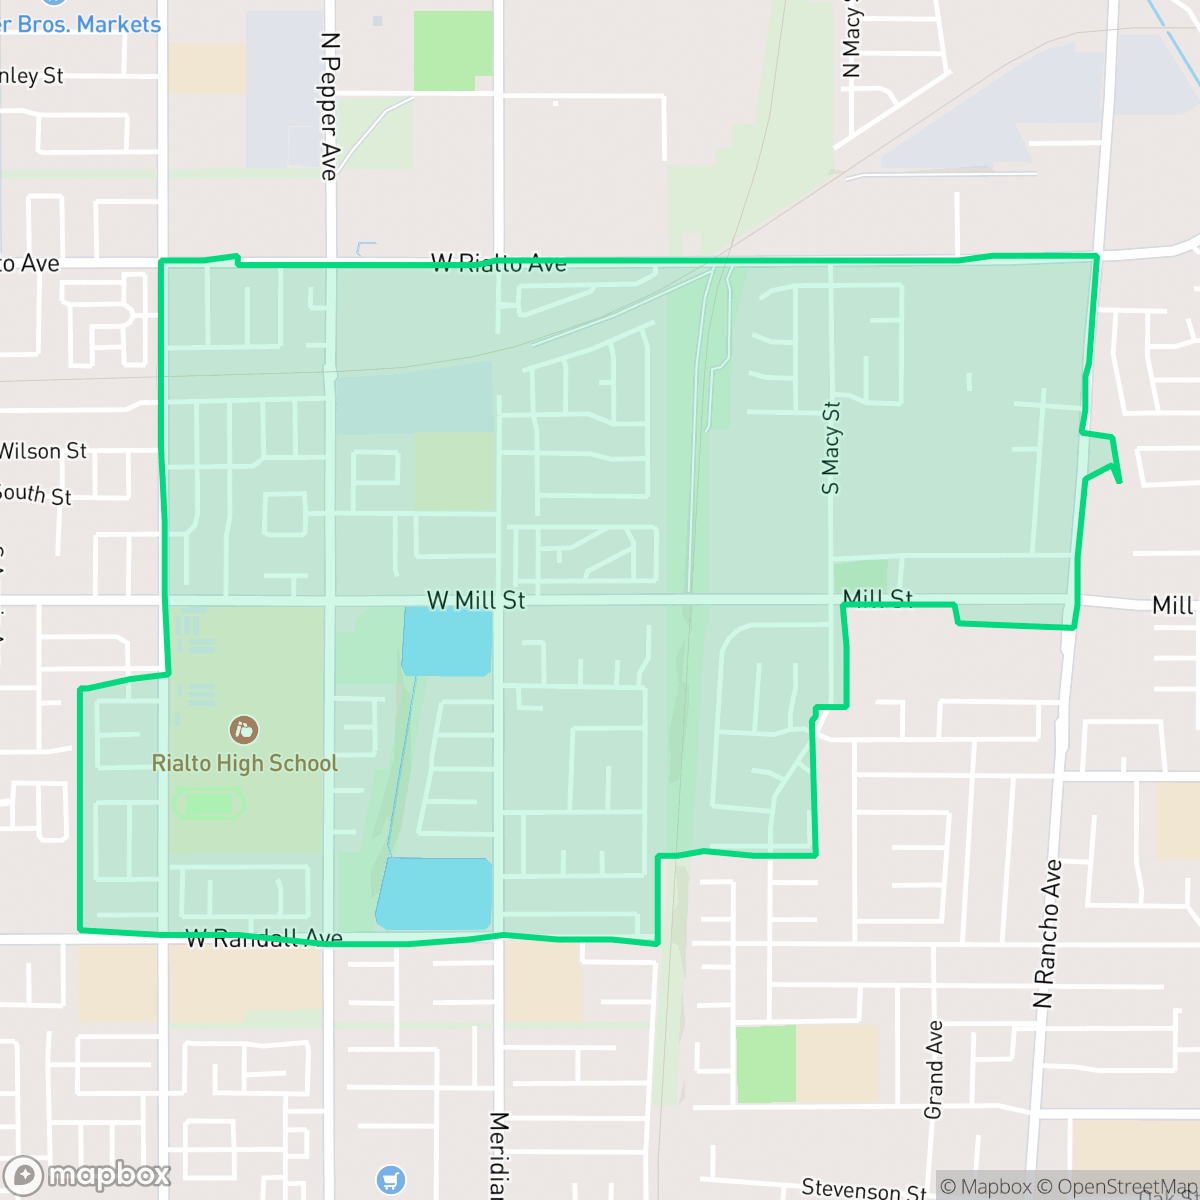
Rancho West is a dense, quiet suburban neighborhood in San Bernardino characterized by a mix of mobile home parks and modest tract housing. While the area offers a traditional grid street layout, residents experience limited privacy due to high housing density and proximity to regional logistics hubs.
Key Highlights
About Rancho West
Located in San Bernardino, the neighborhood consists of a dense suburban landscape dominated by mobile home communities and single-family tract housing. The area is defined by its proximity to regional logistics infrastructure, including warehouses and freight corridors that contribute to the local acoustic environment. Despite this industrial presence, the neighborhood maintains a quiet atmosphere with local dining options such as the Rodeo Cafe and various bakeries integrated into the street grid.
Prospective residents should note that the area features high-density living with limited yard space and minimal public green buffers, which impacts both privacy and pet-friendliness. While the grid layout supports basic pedestrian movement on internal streets, major industrial roads and rail lines can create obstacles for those traveling on foot. The community is served by the Rialto Unified School District, and those considering the area should be aware of environmental risks, specifically regarding fire and flood safety.
Neighborhood Scores Across 15 Qualities
Residential structures and mobile homes are positioned closely together with narrow gaps between units. This density is notably higher than the San Bernardino average, which may result in limited separation between neighbors.
Pedestrian transit is supported by a consistent sidewalk network on residential streets and major thoroughfares, making it slightly more walkable than the San Bernardino average. While internal residential roads are well-connected, high-traffic arterial roads and certain industrial corridors can present obstacles for walkers.
Standard tract housing and mobile home parks define the landscape, featuring small yards and repetitive roof geometries. This visual character is consistent with the average for San Bernardino.
Public green space and park access are scarce in this area. Most greenery is confined to private yards or fenced school grounds, making it less dog-friendly than the San Bernardino average.
Residential patterns consist of dense suburban housing tracts and mobile home parks, which is slightly less open than the San Bernardino average. Most areas feature established street grids, cul-de-sacs, and a mix of single-family homes and light industrial lots.
Suburban streets and industrial corridors provide a steady but low-key atmosphere that is slightly less active than the San Bernardino average. While a few local dining options and parks are accessible, the area primarily features a mix of residential space and light industrial units.
A steady hum from local traffic persists near busy nearby streets, though the acoustic environment remains more stable than the San Bernardino average according to iHuus data.
Air quality is generally good with only rare instances of elevated readings, though it remains slightly below the San Bernardino average according to iHuus data.
Residential and institutional areas dominate this neighborhood, making it notably quieter than the San Bernardino average. While some warehouses and logistics hubs are present in specific sections, the area lacks significant heavy industrial hazards.
Health insurance coverage among residents is notably higher than the San Bernardino average, according to iHuus data.
Voting patterns and census indicators in Rancho West lean significantly more liberal than the San Bernardino average, according to iHuus data.
Residents live alongside a diverse mix of young adults, families, and older individuals. This age distribution is consistent with the broader San Bernardino area, according to iHuus data.
Flood risk in this area is significantly higher than the San Bernardino average. Residents should prepare for elevated or potentially prohibitive flood insurance costs, according to iHuus data.
Block-Level Insights for Rancho West

iHuus Neighborhood Intelligence Insights
Get block-level neighborhood insights for Rancho West
- Street-level scores — see how individual blocks compare, not just neighborhood averages
- Micro-zone boundaries — identify quiet pockets, flood boundaries, and walkable clusters before you visit
- 15 dimensions in full — walkability, noise, air quality, school quality, insurance coverage, population age profile, urban/rural index, and more
- Boundary risk alerts — know if your address sits near a block boundary where scores drop, the kind of detail no listing will ever mention
- School insights — individual school ratings and insights, not just district-level data
- Compare before you commit — side-by-side data across neighborhoods, down to block precision
No credit card required
Compare with Any Neighborhood
| Dimension | Rancho West | Alessandro |
|---|---|---|
| 🚶 Walkabilityavg 7.12 | ||
| 🔊 Acoustic Comfortavg 4.28 | ||
| 🤫 Privacy Indexavg 5.05 | ||
| 🎨 Visual Appealavg 5.64 | ||
| 🐕 Dog Friendlinessavg 5.15 | ||
| 🗺️ Urban-Rural Indexavg 6.67 | ||
| ✨ Neighborhood Vibeavg 4.38 | ||
| 🏥 Health Insurance Coverageavg 5.05 | ||
| 🌿 Air Qualityavg 9.16 | ||
| 🏭 Industrial Proximityavg 6.81 | ||
| 🌊 Flood Safetyavg 1.26 | ||
| 🗳️ Ideological Leanavg 8.58 | ||
| 👥 Population Age Profileavg 4.36 | ||
| 🔥 Fire Safetyavg 0.3 | ||
| 🏫 School Quality |
Rancho West Rankings
School Districts Serving Rancho West
Rialto Unified School District operates as a stable but struggling 'Mixed' organization characterized by high graduation rates and strong extracurricular programs contrasted against critically low state testing proficiency. While the district maintains strong community loyalty and has taken aggressive steps to modernize campus security and parent communication following recent safety incidents, it suffers from a significant internal achievement gap where nearly one-third of its schools are underperforming (3/10 or lower). Its financial and operational standing is bolstered by successful teacher retention and award-winning induction programs, yet it remains in a transitional phase as it attempts to balance campus safety mandates with the need to improve core academic outcomes.
Schools
Colton Joint Unified School District is currently in a distressed state characterized by a sharp academic divide and significant performance gaps in its middle and elementary schools. While flagship institutions like Grand Terrace High School offer high graduation rates and specialized CTE pathways, the district-wide proficiency in core subjects remains critically low, and several schools are operating with 1/10 ratings. Operational health is hampered by aging infrastructure and community concerns over safety and administrative transparency, though efforts to modernize the bus fleet and maintain student engagement in extracurriculars provide a minor buffer against complete institutional decline.
Schools
School Insights for Rancho West
Below average outcomes; significant attendance and academic challenges.
School Insights
See what's really behind every school rating near Rancho West
- Individual school ratings — each school's own score with outcome context, not just a district average
- Enrollment & class size data — student-to-teacher ratio and how it compares to the state average
- Full demographics breakdown — ethnicity and gender composition for every school in the enrollment zone
- Every school in the district — all schools within the enrollment boundary ranked by rating, not just the closest one
- Grade levels & benchmarks — elementary through high school, with below/above state-average flags
No credit card required