Lytle Creek, San Bernardino
Updated June 22, 2026 · 4,871 residents
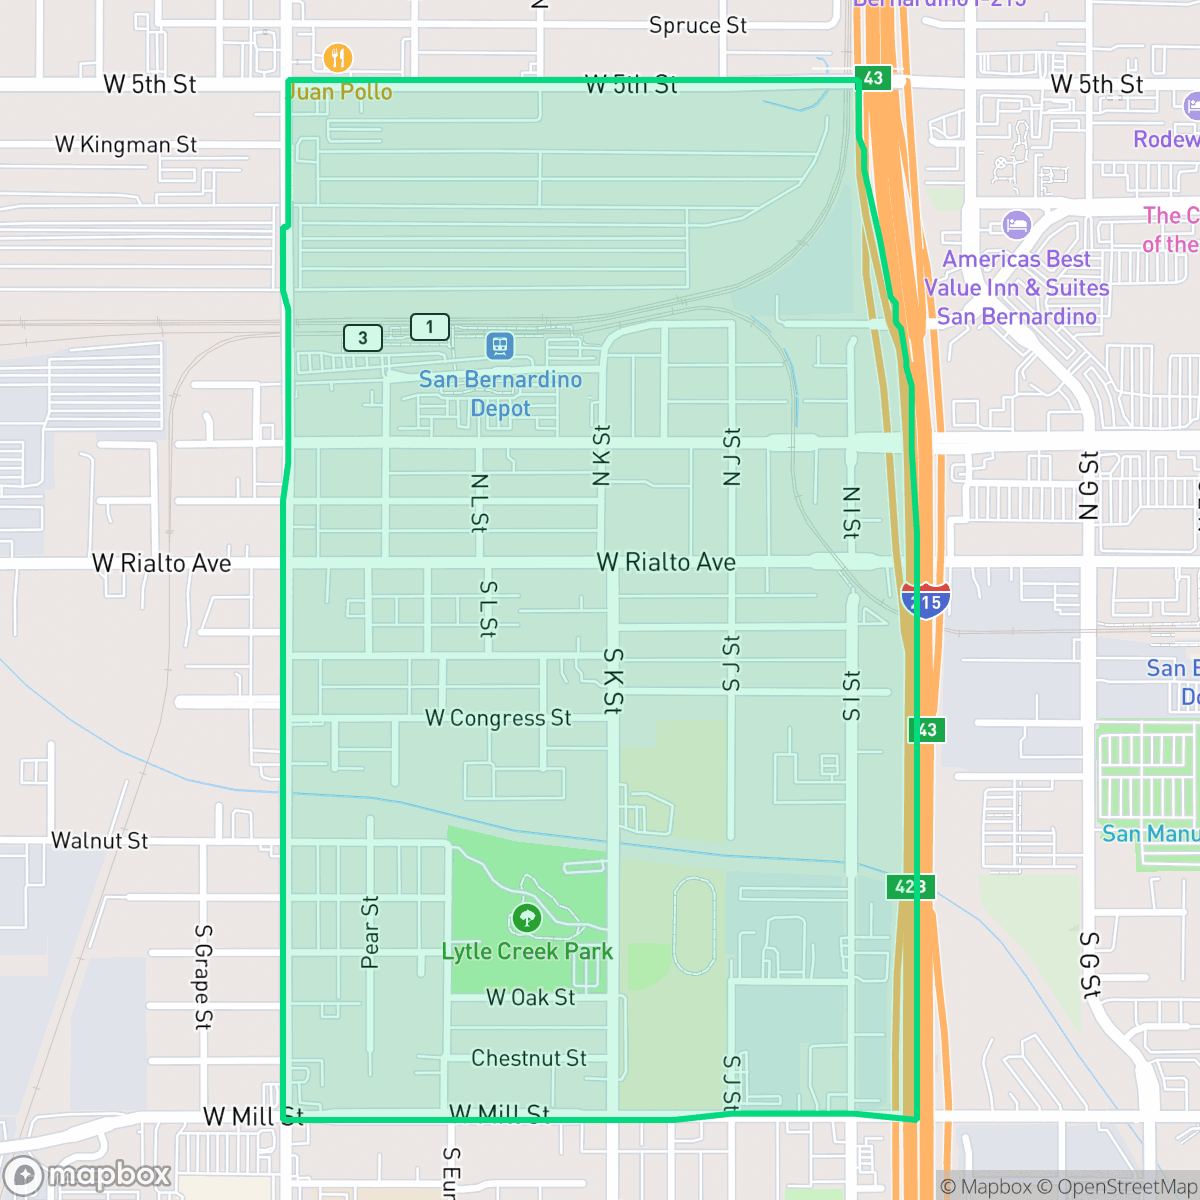
Lytle Creek is a dense, grid-based residential neighborhood in San Bernardino situated near major logistics and rail infrastructure. Residents enjoy high walkability and excellent air quality, though the area is defined by closely spaced housing and consistent noise from local road traffic.
Key Highlights
About Lytle Creek
This neighborhood serves as a dense suburban enclave, defined by a structured grid layout that integrates single-family homes and multi-unit complexes with significant industrial and logistics facilities. Its location is heavily influenced by the presence of a large central intermodal rail yard and surrounding warehouses, which shape the local economy and urban character. The area maintains a functional design, prioritizing accessibility and proximity to major transit corridors over expansive private landscapes.
Living in the area involves specific trade-offs, particularly regarding acoustic comfort and environmental safety, as the neighborhood experiences noticeable road traffic noise and faces elevated risks related to flooding and fire. While the residential density results in limited privacy for homeowners, the community benefits from a high degree of walkability and access to local green spaces. Prospective residents should consider the district's mixed educational landscape, which includes high-performing options like Richardson Prep Hi Middle alongside broader district-wide challenges.
Neighborhood Scores Across 15 Qualities
Residential lots feature mixed spacing with some buffer zones between neighbors, though certain pockets contain closely packed structures with minimal distance between houses. This level of density is slightly higher than the San Bernardino city average, according to iHuus data.
Sidewalks and park paths are available on many streets, though high-traffic arterials and industrial zones make walking less convenient than in other parts of San Bernardino. According to iHuus data, navigating the area on foot is possible but can be interrupted by frequent driveway crossings and busy roadways.
Dense tract housing and mobile home parks characterize the area, featuring small yards and high roof-to-lot ratios. This visual landscape is slightly below the San Bernardino average due to cramped lots and limited private greenery.
Walking dogs is challenging due to narrow sidewalk verges and primarily fenced private yards. While a central park and college campus provide some green space, overall accessibility to open areas is below the San Bernardino average.
Open land and woodland are common throughout the area, providing a landscape that is slightly less urbanized than the San Bernardino average. Residential pockets often sit among scattered fields and natural terrain according to iHuus data.
A mix of industrial warehouses and suburban streets creates a steady but low-key atmosphere. While local dining and green spaces are available, the area is largely car-dependent and sits slightly below the San Bernardino average for activity levels.
Frequent noise from nearby freeways and railroad tracks characterizes this area, resulting in acoustic levels that are worse than the San Bernardino average.
Air quality remains exceptionally clean with minimal pollution concerns, performing significantly better than the San Bernardino average according to iHuus data.
Large logistics warehouses and intermodal rail facilities border certain residential sections, resulting in lower industrial density than the San Bernardino average. Residents may experience increased heavy truck traffic and noise near the southern and eastern edges of the area.
Health insurance accessibility is significantly lower than the San Bernardino average, according to iHuus data. Most residents in this area lack employer-sponsored or private medical coverage.
Voting patterns and census indicators in Lytle Creek show a notably stronger liberal lean than the San Bernardino city average, according to iHuus data.
A diverse range of age groups resides here, including young adults, families, and seniors. This demographic distribution is roughly in line with the San Bernardino average.
Flood risk in this area is significantly elevated, presenting potential challenges for property owners regarding insurance costs and safety. This vulnerability is slightly higher than the average for San Bernardino.
Block-Level Insights for Lytle Creek

iHuus Neighborhood Intelligence Insights
Get block-level neighborhood insights for Lytle Creek
- Street-level scores — see how individual blocks compare, not just neighborhood averages
- Micro-zone boundaries — identify quiet pockets, flood boundaries, and walkable clusters before you visit
- 15 dimensions in full — walkability, noise, air quality, school quality, insurance coverage, population age profile, urban/rural index, and more
- Boundary risk alerts — know if your address sits near a block boundary where scores drop, the kind of detail no listing will ever mention
- School insights — individual school ratings and insights, not just district-level data
- Compare before you commit — side-by-side data across neighborhoods, down to block precision
No credit card required
Compare with Any Neighborhood
| Dimension | Lytle Creek | Alessandro |
|---|---|---|
| 🚶 Walkabilityavg 7.12 | ||
| 🔊 Acoustic Comfortavg 4.28 | ||
| 🤫 Privacy Indexavg 5.05 | ||
| 🎨 Visual Appealavg 5.64 | ||
| 🐕 Dog Friendlinessavg 5.15 | ||
| 🗺️ Urban-Rural Indexavg 6.67 | ||
| ✨ Neighborhood Vibeavg 4.38 | ||
| 🏥 Health Insurance Coverageavg 5.05 | ||
| 🌿 Air Qualityavg 9.16 | ||
| 🏭 Industrial Proximityavg 6.81 | ||
| 🌊 Flood Safetyavg 1.26 | ||
| 🗳️ Ideological Leanavg 8.58 | ||
| 👥 Population Age Profileavg 4.36 | ||
| 🔥 Fire Safetyavg 0.3 | ||
| 🏫 School Quality |
Lytle Creek Rankings
School Districts Serving Lytle Creek
San Bernardino City Unified is a district in transition, characterized by a 'tale of two districts' where prestigious magnet programs and high-performing schools in the Highland area contrast sharply with a high volume of underperforming schools in impoverished sectors. While the district maintains financial stability through bond-funded facility upgrades and is aggressively expanding successful Career Technical Education (CTE) pathways, it is heavily burdened by significant safety concerns, teacher retention issues, and core math proficiency that lags state averages. The organization's health is currently moderate, buoyed by specialized successes but weighed down by systemic operational challenges and a portfolio where nearly one-third of the schools fall in the bottom tier of state ratings.
Schools
School Insights for Lytle Creek
Below average outcomes; significant attendance and academic challenges.
School Insights
See what's really behind every school rating near Lytle Creek
- Individual school ratings — each school's own score with outcome context, not just a district average
- Enrollment & class size data — student-to-teacher ratio and how it compares to the state average
- Full demographics breakdown — ethnicity and gender composition for every school in the enrollment zone
- Every school in the district — all schools within the enrollment boundary ranked by rating, not just the closest one
- Grade levels & benchmarks — elementary through high school, with below/above state-average flags
No credit card required