Amtrak, San Bernardino
Updated June 22, 2026 · 4,337 residents
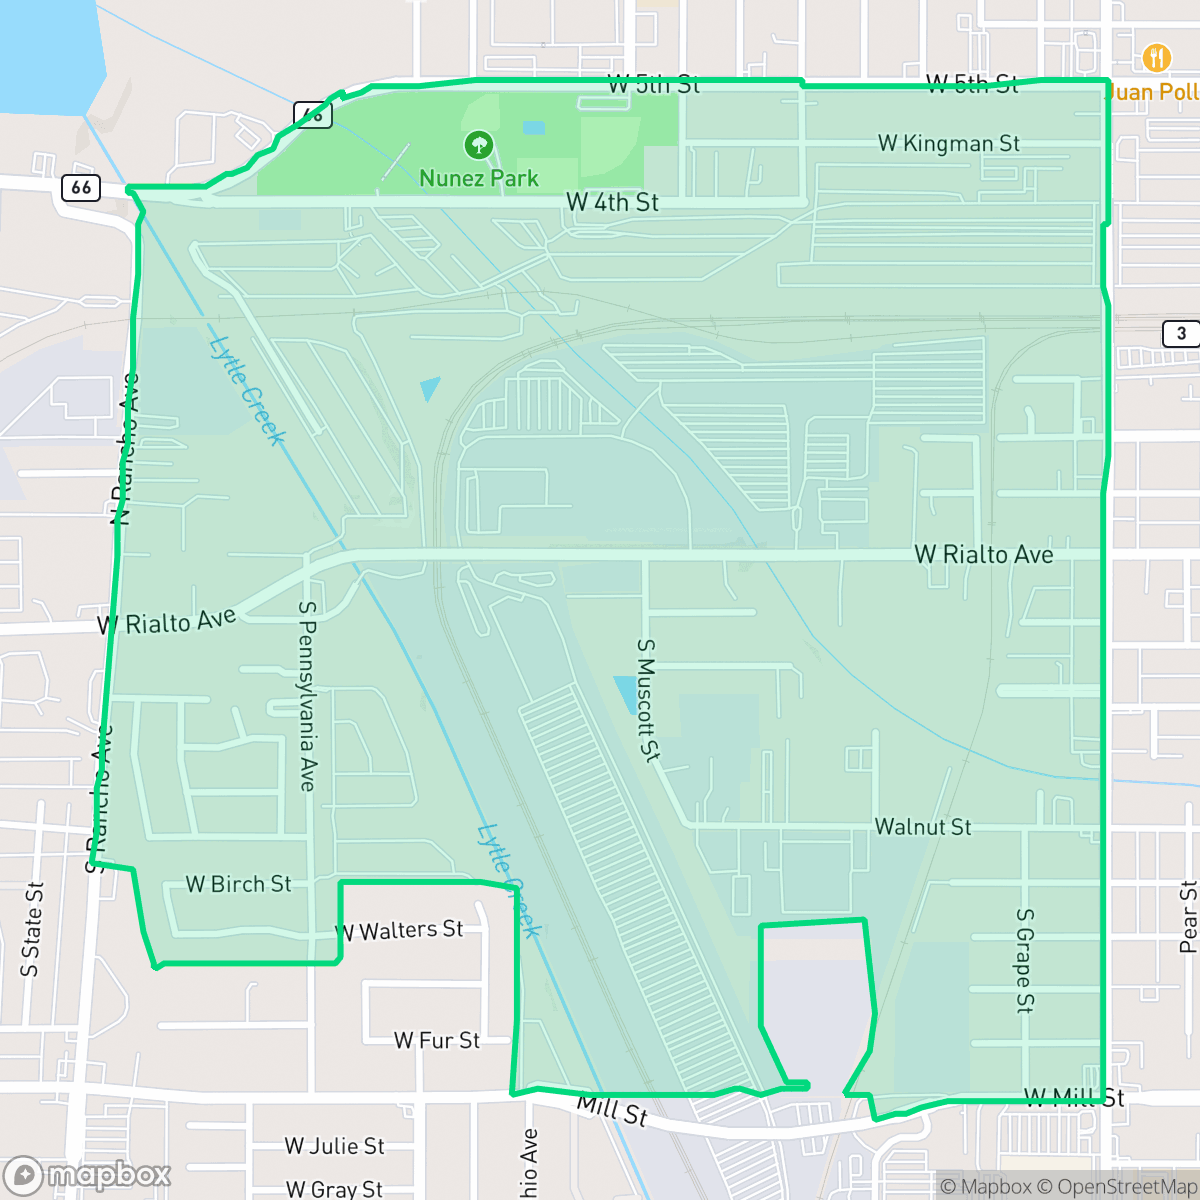
The Amtrak neighborhood in San Bernardino is defined by its extensive industrial landscape, dominated by large-scale logistics facilities and an active rail freight corridor. While the area offers quiet residential blocks, residents experience limited local services and significant truck traffic associated with the nearby transit infrastructure.
Key Highlights
About Amtrak
Centered around major transportation nodes, this neighborhood functions primarily as a logistics and industrial hub for the Inland Empire. The landscape is characterized by a dense mix of residential grids situated alongside massive intermodal rail facilities and warehouse complexes. These features dictate the daily rhythm of the area, which remains quiet and low-key with minimal commercial activity or nightlife options available to the local population.
Prospective residents should note that the neighborhood presents specific trade-offs regarding infrastructure and safety. While the area maintains high air quality, it faces significant challenges related to flood and fire risks. The lack of local amenities and low walkability scores suggest that the area is best suited for those who prioritize proximity to regional logistics employment over access to traditional neighborhood services.
Neighborhood Scores Across 15 Qualities
Homes and mobile units are closely packed with minimal separation between structures. This high density results in less privacy than is typical for San Bernardino.
Sidewalks and park paths are accessible throughout much of the area; however, heavy industrial traffic and rail barriers create notable obstacles for pedestrians. According to iHuus data, the pedestrian network is slightly less connected than the San Bernardino average.
Standard tract housing and mobile home parks characterize this area, offering modest yards and functional designs. The landscape appears slightly less visually varied than the San Bernardino average according to iHuus data.
Public green spaces and wide sidewalk verges are scarce in most residential areas, making dog walking less convenient than in other parts of San Bernardino. While some central parks and campus grounds provide access to grass, many neighborhoods consist primarily of fenced lots and narrow walkways.
Open land and scattered residential pockets exist alongside large-scale logistics and industrial infrastructure. This landscape is slightly less developed than the San Bernardino average, featuring a blend of suburban grids and natural washes.
The area is characterized by a subdued, industrial-suburban atmosphere with limited commercial activity. According to iHuus data, the local vibrancy is notably lower than the San Bernardino average, as much of the landscape consists of warehouses, railways, and freight corridors.
Local traffic from nearby busy streets creates a consistent hum, though acoustic levels are slightly more audible here than in the rest of San Bernardino.
Air quality remains consistently high with minimal health concerns for residents. According to iHuus data, the atmosphere in this area is slightly cleaner than the San Bernardino average.
Significant logistics hubs, rail yards, and warehouse operations border residential areas, making industrial proximity higher than the San Bernardino average. According to iHuus data, residents may encounter frequent heavy truck traffic and rail-related noise near the neighborhood edges.
Health insurance coverage in this area is lower than the San Bernardino average. According to iHuus data, fewer residents in this neighborhood possess medical coverage compared to the rest of the city.
Voting patterns and census indicators reflect a predominantly liberal community, which is more pronounced than the average for San Bernardino. According to iHuus data, the area demonstrates a much higher concentration of liberal-leaning residents compared to the rest of the city.
Residents live alongside a diverse range of age groups, including young adults, families, and seniors. This distribution is roughly in line with the average age profile seen throughout San Bernardino.
Flood risk in this area is significantly higher than the San Bernardino average. Residents should prepare for elevated or prohibitive flood insurance costs according to iHuus data.
Block-Level Insights for Amtrak

iHuus Neighborhood Intelligence Insights
Get block-level neighborhood insights for Amtrak
- Street-level scores — see how individual blocks compare, not just neighborhood averages
- Micro-zone boundaries — identify quiet pockets, flood boundaries, and walkable clusters before you visit
- 15 dimensions in full — walkability, noise, air quality, school quality, insurance coverage, population age profile, urban/rural index, and more
- Boundary risk alerts — know if your address sits near a block boundary where scores drop, the kind of detail no listing will ever mention
- School insights — individual school ratings and insights, not just district-level data
- Compare before you commit — side-by-side data across neighborhoods, down to block precision
No credit card required
Compare with Any Neighborhood
| Dimension | Amtrak | Alessandro |
|---|---|---|
| 🚶 Walkabilityavg 7.12 | ||
| 🔊 Acoustic Comfortavg 4.28 | ||
| 🤫 Privacy Indexavg 5.05 | ||
| 🎨 Visual Appealavg 5.64 | ||
| 🐕 Dog Friendlinessavg 5.15 | ||
| 🗺️ Urban-Rural Indexavg 6.67 | ||
| ✨ Neighborhood Vibeavg 4.38 | ||
| 🏥 Health Insurance Coverageavg 5.05 | ||
| 🌿 Air Qualityavg 9.16 | ||
| 🏭 Industrial Proximityavg 6.81 | ||
| 🌊 Flood Safetyavg 1.26 | ||
| 🗳️ Ideological Leanavg 8.58 | ||
| 👥 Population Age Profileavg 4.36 | ||
| 🔥 Fire Safetyavg 0.3 | ||
| 🏫 School Quality |
Amtrak Rankings
School Districts Serving Amtrak
Rialto Unified School District operates as a stable but struggling 'Mixed' organization characterized by high graduation rates and strong extracurricular programs contrasted against critically low state testing proficiency. While the district maintains strong community loyalty and has taken aggressive steps to modernize campus security and parent communication following recent safety incidents, it suffers from a significant internal achievement gap where nearly one-third of its schools are underperforming (3/10 or lower). Its financial and operational standing is bolstered by successful teacher retention and award-winning induction programs, yet it remains in a transitional phase as it attempts to balance campus safety mandates with the need to improve core academic outcomes.
Schools
San Bernardino City Unified is a district in transition, characterized by a 'tale of two districts' where prestigious magnet programs and high-performing schools in the Highland area contrast sharply with a high volume of underperforming schools in impoverished sectors. While the district maintains financial stability through bond-funded facility upgrades and is aggressively expanding successful Career Technical Education (CTE) pathways, it is heavily burdened by significant safety concerns, teacher retention issues, and core math proficiency that lags state averages. The organization's health is currently moderate, buoyed by specialized successes but weighed down by systemic operational challenges and a portfolio where nearly one-third of the schools fall in the bottom tier of state ratings.
Schools
Colton Joint Unified School District is currently in a distressed state characterized by a sharp academic divide and significant performance gaps in its middle and elementary schools. While flagship institutions like Grand Terrace High School offer high graduation rates and specialized CTE pathways, the district-wide proficiency in core subjects remains critically low, and several schools are operating with 1/10 ratings. Operational health is hampered by aging infrastructure and community concerns over safety and administrative transparency, though efforts to modernize the bus fleet and maintain student engagement in extracurriculars provide a minor buffer against complete institutional decline.
Schools
School Insights for Amtrak
Below average outcomes; significant attendance and academic challenges.
School Insights
See what's really behind every school rating near Amtrak
- Individual school ratings — each school's own score with outcome context, not just a district average
- Enrollment & class size data — student-to-teacher ratio and how it compares to the state average
- Full demographics breakdown — ethnicity and gender composition for every school in the enrollment zone
- Every school in the district — all schools within the enrollment boundary ranked by rating, not just the closest one
- Grade levels & benchmarks — elementary through high school, with below/above state-average flags
No credit card required