Seccombe Lane, San Bernardino
Updated · 4,764 residents
Seccombe Lane is a central San Bernardino neighborhood defined by its exceptional walkability and a vibrant, high-energy urban landscape. While the area offers convenient access to diverse local businesses and eateries, residents should expect notable noise from road traffic and a dense, suburban-grid layout.
Key Highlights
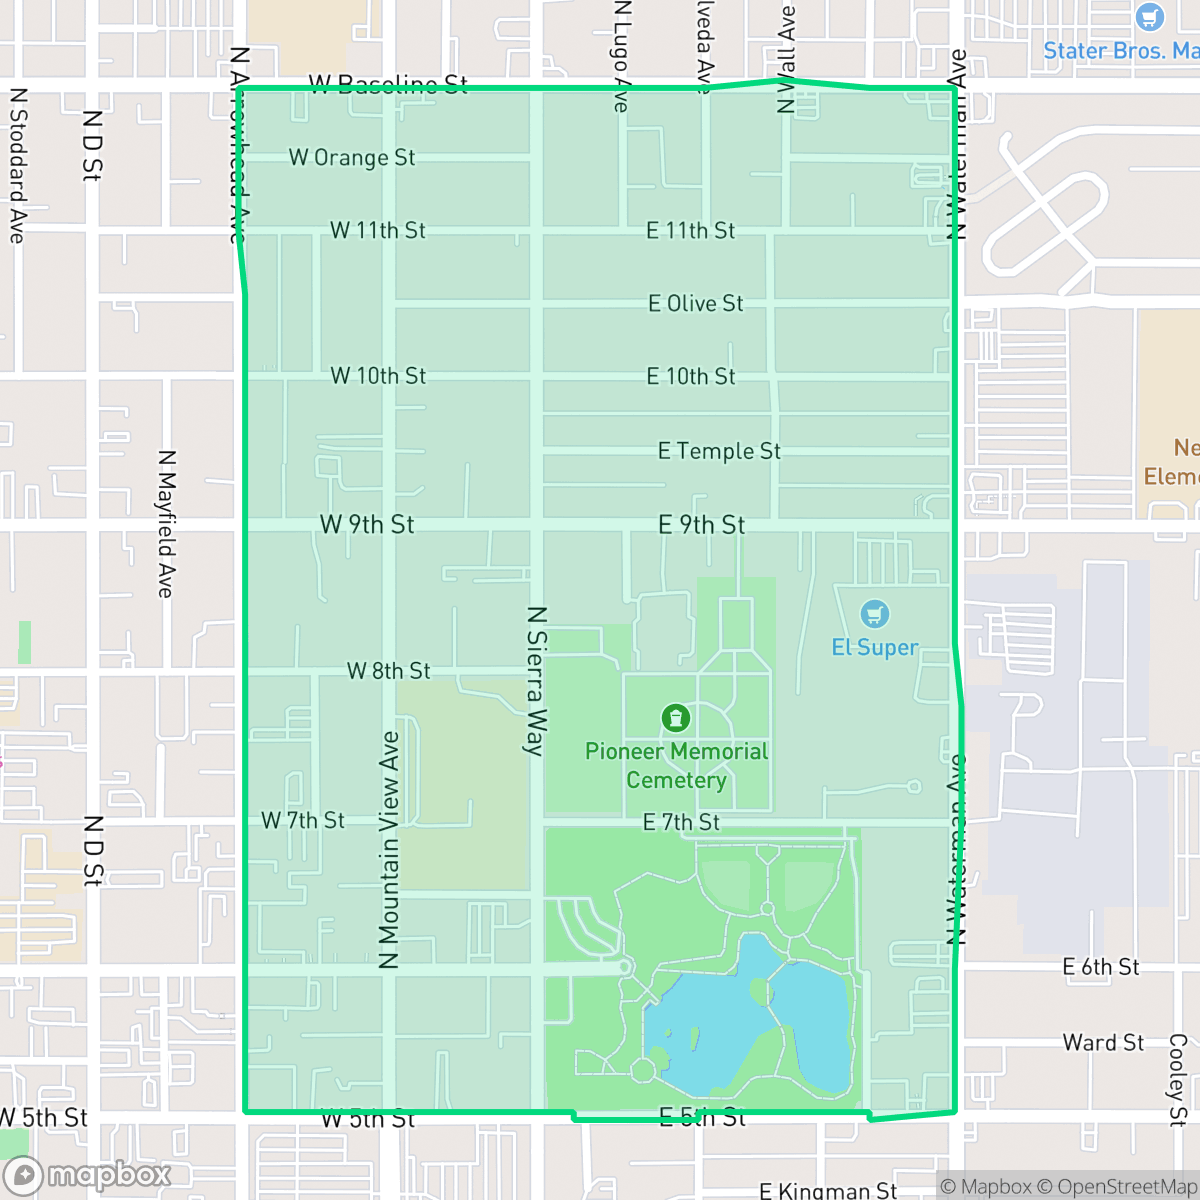
About Seccombe Lane
Located in the heart of San Bernardino, this neighborhood functions as a dense urban grid characterized by a mix of single-family homes, light industrial units, and institutional landmarks like the Set Free Church Central City. The area maintains a lively atmosphere with a variety of local dining options, such as Miyagi Sushi and La Luna Bakery, contributing to an active street life that keeps the community feeling connected and busy throughout the day.
Prospective residents should weigh the benefits of high walkability and excellent air quality against specific environmental and infrastructure trade-offs. The neighborhood experiences significant road traffic noise and is situated near industrial zones with heavy vehicle activity. Additionally, the area faces challenges regarding flood and fire safety, and the local school district is currently undergoing a period of transition with varied performance outcomes across its facilities.
Neighborhood Scores Across 15 Qualities
Residential structures are moderately spaced with some shared fencing and varied setbacks. This level of density is roughly in line with the average for San Bernardino.
Pedestrians benefit from a consistent grid of streets with sidewalks and clear crosswalks at main intersections. This level of accessibility for walking is notably higher than the San Bernardino city average.
Dense, standard tract housing dominates the area, featuring repetitive rooflines and modest yards. According to iHuus data, the visual variety and presence of luxury amenities like private pools are lower than the San Bernardino average.
Minimal public green space and narrow sidewalk verges make finding walking routes difficult. According to iHuus data, the area lacks the accessible parkland found more frequently across the rest of San Bernardino.
Open land and scattered homes provide a semi-rural feel that is slightly less dense than the San Bernardino average. According to iHuus data, the area features a mix of low-density urban grids and infrequent open spaces.
Local businesses, churches, and parks provide a noticeably higher level of activity and social engagement than the San Bernardino average. While many areas are car-dependent, the presence of diverse dining and community landmarks creates a lively atmosphere according to iHuus data.
Local traffic from nearby busy streets creates a persistent hum. This level of acoustic activity is slightly higher than the average for San Bernardino, according to iHuus data.
Air quality remains consistently high with minimal health concerns, though it sits slightly below the San Bernardino city average according to iHuus data.
Largely residential streets are occasionally bordered by light commercial lots and warehouse structures. According to iHuus data, the area has less industrial presence than the San Bernardino average.
Access to health insurance is lower here than the city average, according to iHuus data. Residents may find fewer local options for employer-sponsored or private coverage compared to other parts of San Bernardino.
Voting patterns and census indicators show a notably more liberal leaning than the San Bernardino average, according to iHuus data.
A diverse range of age groups, including young adults, families, and seniors, resides here. This age distribution is slightly lower than the San Bernardino average according to iHuus data.
Address-Level Insights for Seccombe Lane


iHuus Neighborhood Intelligence Insights
Get address-level neighborhood insights for Seccombe Lane
- Street-level scores — see how individual blocks compare, not just neighborhood averages
- Micro-zone boundaries — identify quiet pockets, flood boundaries, and walkable clusters before you visit
- 15 dimensions in full — walkability, noise, air quality, school quality, insurance coverage, population age profile, urban/rural index, and more
- Boundary risk alerts — know if your address sits near a block boundary where scores drop, the kind of detail no listing will ever mention
- School insights — individual school ratings and insights, not just district-level data
- Compare before you commit — side-by-side data across neighborhoods, down to block precision
No credit card required
Compare with Any Neighborhood
| Dimension | Seccombe Lane | Alessandro |
|---|---|---|
| 🚶 Walkabilityavg 7.12 | ||
| 🔊 Acoustic Comfortavg 4.28 | ||
| 🤫 Privacy Indexavg 5.05 | ||
| 🎨 Visual Appealavg 5.64 | ||
| 🐕 Dog Friendlinessavg 5.15 | ||
| 🗺️ Urban-Rural Indexavg 6.67 | ||
| ✨ Neighborhood Vibeavg 4.38 | ||
| 🏥 Health Insurance Coverageavg 5.05 | ||
| 🌿 Air Qualityavg 9.16 | ||
| 🏭 Industrial Proximityavg 6.81 | ||
| 🌊 Flood Safetyavg 1.26 | ||
| 🗳️ Ideological Leanavg 8.58 | ||
| 👥 Population Age Profileavg 4.36 | ||
| 🔥 Fire Safetyavg 0.3 | ||
| 🏫 School Quality |
Seccombe Lane Rankings
School Districts Serving Seccombe Lane
School Insights for Seccombe Lane
Below average outcomes; significant attendance and academic challenges.
School Insights
See what's really behind every school rating near Seccombe Lane
- Individual school ratings — each school's own score with outcome context, not just a district average
- Enrollment & class size data — student-to-teacher ratio and how it compares to the state average
- Full demographics breakdown — ethnicity and gender composition for every school in the enrollment zone
- Every school in the district — all schools within the enrollment boundary ranked by rating, not just the closest one
- Grade levels & benchmarks — elementary through high school, with below/above state-average flags
No credit card required