Mount Vernon, San Bernardino
Updated June 22, 2026 · 3,927 residents
Mount Vernon is a suburban neighborhood in San Bernardino characterized by its grid-based layout and proximity to major logistics warehouses. While residents benefit from a central location, the area experiences significant noise from road traffic and offers limited public green space for recreation.
Key Highlights
About Mount Vernon
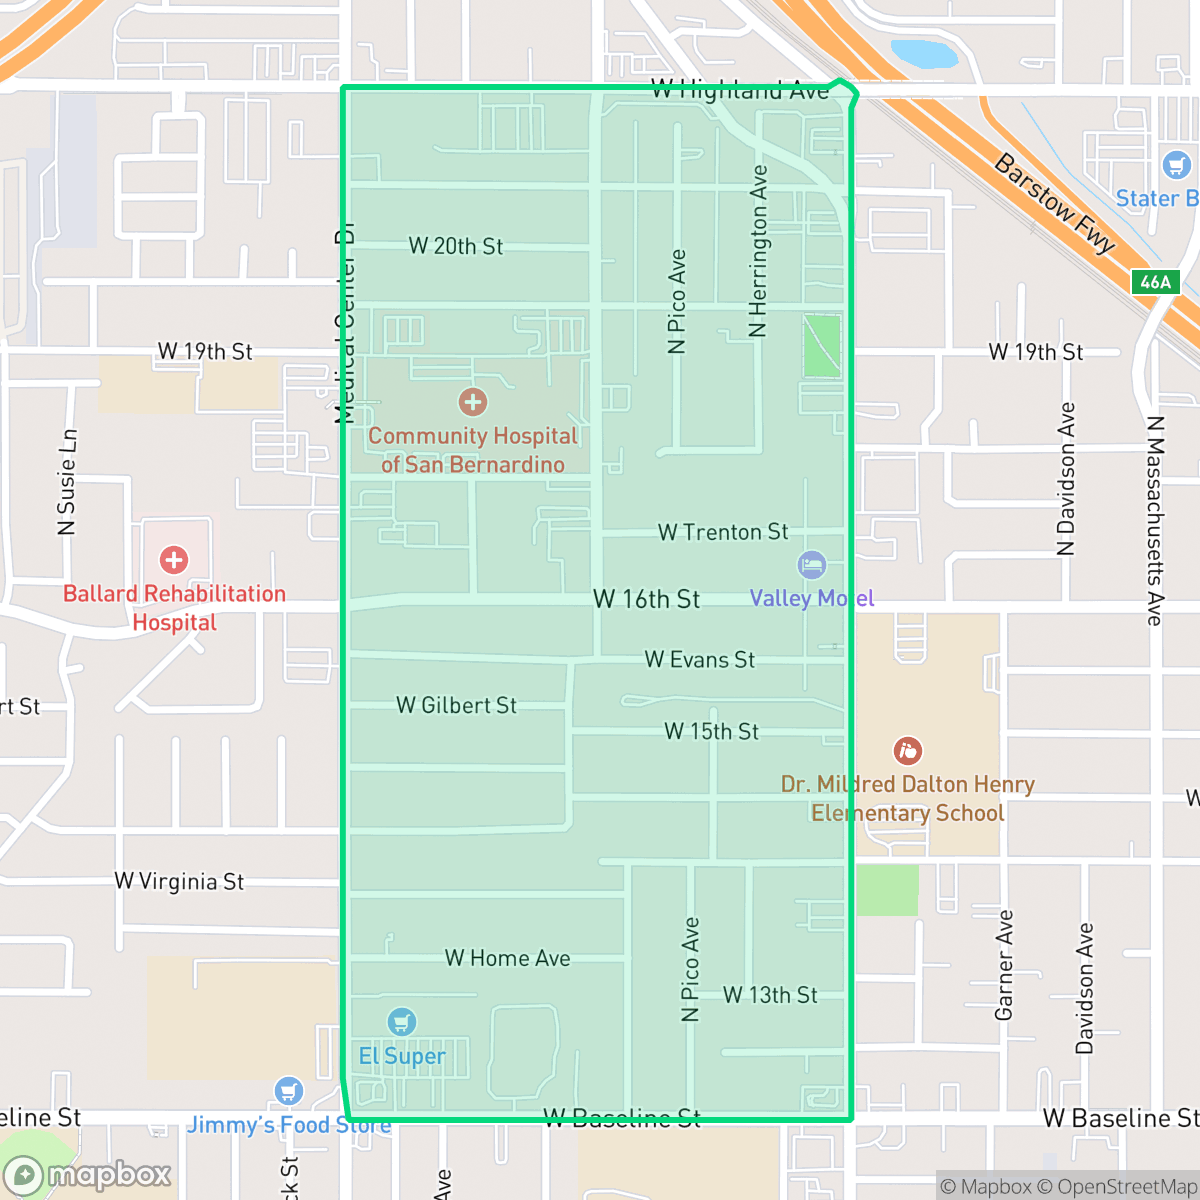
The Mount Vernon neighborhood, situated on San Bernardino’s Westside, traces its name to an 1854 adobe schoolhouse founded by pioneer Joseph “Uncle Joe” Hancock. By the mid-20th century, the Mount Vernon Avenue corridor—which carried Route 66—evolved into a vibrant cultural and commercial hub for the city’s Mexican American and Black communities. It became home to landmarks like the historic Mitla Cafe, opened in 1937, which served as a meeting ground for civil rights organizers and famously inspired the creation of Taco Bell. The neighborhood’s landscape was dramatically altered in 1959 by the construction of the Interstate 215 freeway. Dubbed the “Berlin Wall” by locals, the freeway physically bifurcated the community, diverted traffic away from local businesses like Ybarra’s Market, and cemented lines of racial segregation.
The neighborhood functions as a dense suburban environment where residential streets intersect with heavy commercial activity and freight corridors. The landscape consists primarily of modest tract housing situated on small lots, creating a consistent but utilitarian aesthetic. Residents have access to local services and walkable paths, though the lack of shade and the presence of high-traffic arterial roads can impact the overall pedestrian experience. The area is heavily influenced by its proximity to major highways, which contributes to elevated noise levels and a distinct industrial backdrop according to iHuus data.
Living in this part of the city involves trade-offs regarding environmental and safety factors. The infrastructure is marked by a high density of logistics facilities, which shapes the daily rhythm of the community. Prospective residents should note the limited access to public parks and the specific challenges related to flood and fire safety, which are significant considerations in this region. The school district serves the area with a focus on career technical education, though families may encounter variability in school performance and facility resources.
Neighborhood Scores Across 15 Qualities
Residential lots often feature closely packed housing with minimal distance between neighbors. According to iHuus data, this level of density is slightly higher than the San Bernardino average, resulting in reduced natural spacing between homes.
Many residential streets feature consistent sidewalks and safe crossings, matching the city average for walkability. While the grid layout supports pedestrian movement, proximity to heavy traffic and a lack of shade can reduce comfort during warmer periods.
Standard tract housing and high-density residential layouts define the area; the visual landscape is less varied than the San Bernardino average due to smaller lots and more frequent dirt patches in yards. According to iHuus data, the neighborhood features primarily modest homes and mobile home parks with limited luxury amenities.
Public parks and school athletic fields provide decent space for exercise, though the neighborhood is slightly more dog friendly than the San Bernardino average. Residents will find limited grass verges on residential streets, as most greenery is contained within private fenced yards.
Residential grids in this area feature a mix of single-family homes, apartments, and industrial warehouses. This landscape is slightly more developed than the city average, offering a balance of built environments and accessible greenery.
Suburban streets and green spaces provide a serene rhythm of services, though the area features more industrial warehouses and freight corridors than the San Bernardino average. While various dining options and churches are present, many businesses are not easily reachable on foot.
Steady traffic sounds from nearby busy streets are present, though acoustic levels are slightly more favorable than the San Bernardino average according to iHuus data.
Air quality remains generally good with infrequent periods of elevated readings, though it is slightly lower than the San Bernardino city average according to iHuus data.
Residential and educational spaces dominate this area, offering much less exposure to heavy industry than the San Bernardino average. While some large warehouses and logistics centers are visible in certain sections, most of the neighborhood lacks significant industrial hazards.
Health insurance access is notably lower in this area than in the rest of San Bernardino. According to iHuus data, a small portion of the population maintains medical coverage.
Voting patterns and census indicators reflect a predominantly liberal political leaning. This area exhibits a more liberal orientation than the San Bernardino city average, according to iHuus data.
Residents live alongside a varied demographic of young adults, families, and seniors. According to iHuus data, this age distribution is largely consistent with the broader San Bernardino area.
Block-Level Insights for Mount Vernon

iHuus Neighborhood Intelligence Insights
Get block-level neighborhood insights for Mount Vernon
- Street-level scores — see how individual blocks compare, not just neighborhood averages
- Micro-zone boundaries — identify quiet pockets, flood boundaries, and walkable clusters before you visit
- 15 dimensions in full — walkability, noise, air quality, school quality, insurance coverage, population age profile, urban/rural index, and more
- Boundary risk alerts — know if your address sits near a block boundary where scores drop, the kind of detail no listing will ever mention
- School insights — individual school ratings and insights, not just district-level data
- Compare before you commit — side-by-side data across neighborhoods, down to block precision
No credit card required
Compare with Any Neighborhood
| Dimension | Mount Vernon | Alessandro |
|---|---|---|
| 🚶 Walkabilityavg 7.12 | ||
| 🔊 Acoustic Comfortavg 4.28 | ||
| 🤫 Privacy Indexavg 5.05 | ||
| 🎨 Visual Appealavg 5.64 | ||
| 🐕 Dog Friendlinessavg 5.15 | ||
| 🗺️ Urban-Rural Indexavg 6.67 | ||
| ✨ Neighborhood Vibeavg 4.38 | ||
| 🏥 Health Insurance Coverageavg 5.05 | ||
| 🌿 Air Qualityavg 9.16 | ||
| 🏭 Industrial Proximityavg 6.81 | ||
| 🌊 Flood Safetyavg 1.26 | ||
| 🗳️ Ideological Leanavg 8.58 | ||
| 👥 Population Age Profileavg 4.36 | ||
| 🔥 Fire Safetyavg 0.3 | ||
| 🏫 School Quality |
Mount Vernon Rankings
School Districts Serving Mount Vernon
San Bernardino City Unified is a district in transition, characterized by a 'tale of two districts' where prestigious magnet programs and high-performing schools in the Highland area contrast sharply with a high volume of underperforming schools in impoverished sectors. While the district maintains financial stability through bond-funded facility upgrades and is aggressively expanding successful Career Technical Education (CTE) pathways, it is heavily burdened by significant safety concerns, teacher retention issues, and core math proficiency that lags state averages. The organization's health is currently moderate, buoyed by specialized successes but weighed down by systemic operational challenges and a portfolio where nearly one-third of the schools fall in the bottom tier of state ratings.
Schools
School Insights for Mount Vernon
Below average outcomes; significant attendance and academic challenges.
School Insights
See what's really behind every school rating near Mount Vernon
- Individual school ratings — each school's own score with outcome context, not just a district average
- Enrollment & class size data — student-to-teacher ratio and how it compares to the state average
- Full demographics breakdown — ethnicity and gender composition for every school in the enrollment zone
- Every school in the district — all schools within the enrollment boundary ranked by rating, not just the closest one
- Grade levels & benchmarks — elementary through high school, with below/above state-average flags
No credit card required