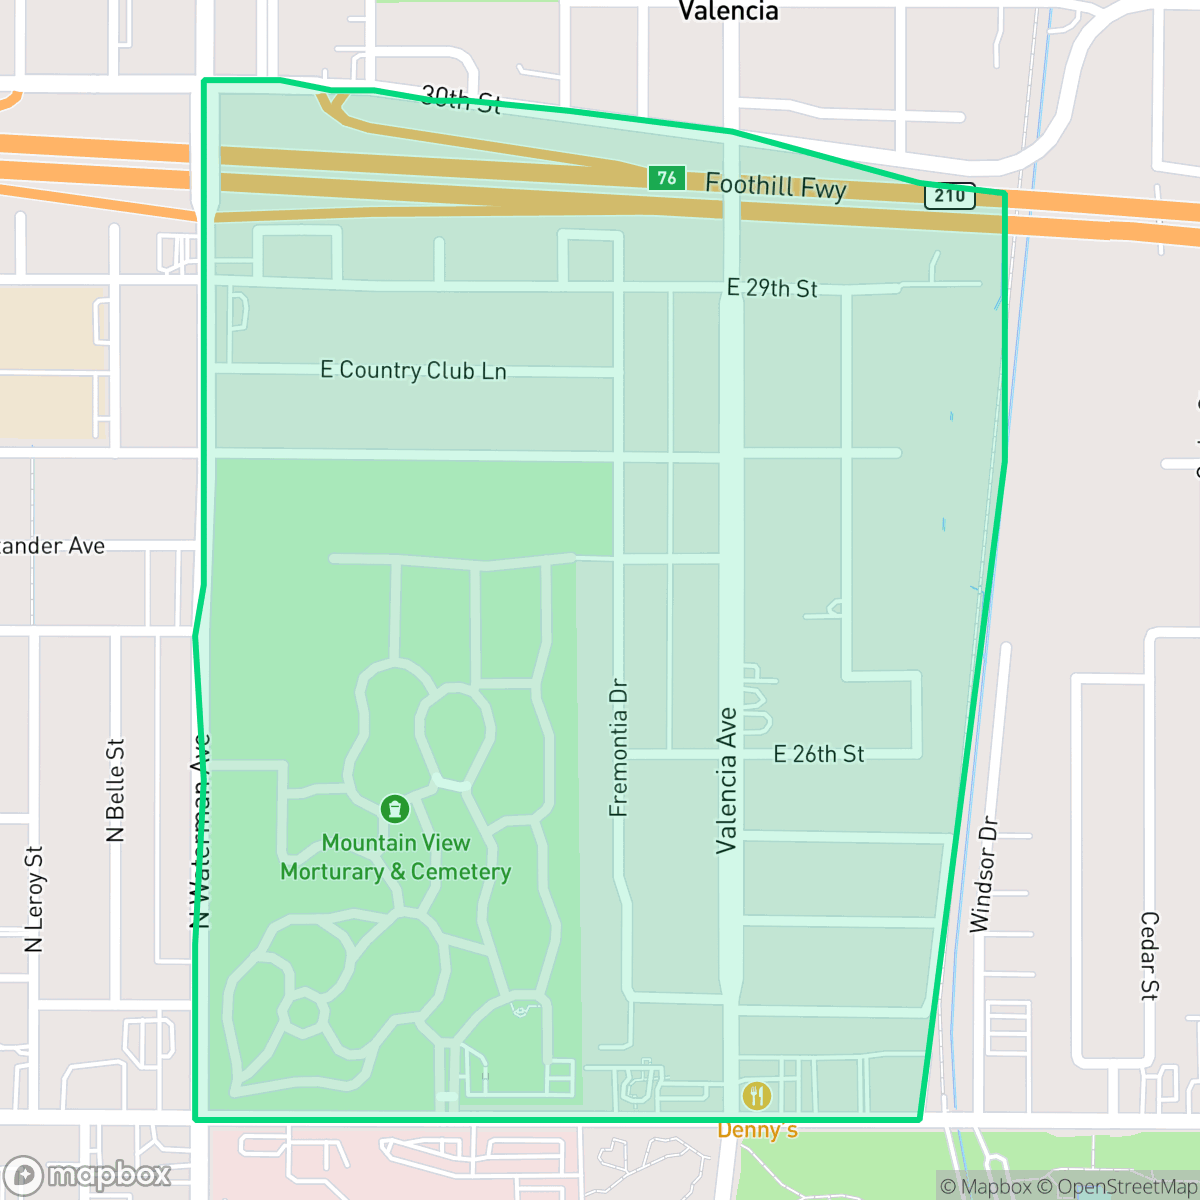
HI-30, San Bernardino
Updated June 22, 2026 · 1,827 residents
HI-30 is a highly walkable and pet-friendly residential enclave in San Bernardino known for its open green spaces and suburban atmosphere. While the area offers excellent air quality and minimal industrial presence, residents should be prepared for significant noise levels from nearby road traffic.
Key Highlights
About HI-30
HI-30 is a predominantly residential neighborhood in San Bernardino characterized by its commitment to green space and pedestrian accessibility. It stands out for its high walkability and welcoming environment for pet owners, offering a quiet, suburban aesthetic that feels removed from industrial activity. The area maintains high marks for visual appeal and air quality, providing a clean environment for its 1,827 residents.
Living here involves specific trade-offs, most notably regarding acoustic comfort, as the neighborhood experiences elevated noise levels primarily due to road traffic. Prospective residents should also be aware of the area’s limited health insurance coverage and environmental risks related to fire and flooding. While the local school district provides diverse educational pathways, the area is best suited for those who prioritize outdoor access and a walkable lifestyle over absolute quiet or proximity to commercial centers.
Neighborhood Scores Across 15 Qualities
Housing density is slightly higher than the San Bernardino average, characterized by closely spaced homes and small side-yard gaps. This layout offers some buffer between neighbors, though many properties feature the small setbacks typical of dense suburban developments.
Continuous sidewalks and a structured grid layout make navigating the area on foot easy and safe. This level of pedestrian accessibility is significantly higher than the San Bernardino average, according to iHuus data.
Large homes and frequent upscale amenities provide a more polished aesthetic than the San Bernardino average. According to iHuus data, the area features spacious driveways and well-maintained properties throughout the neighborhood.
Abundant green spaces and continuous sidewalks offer significantly better walking options for pets than the San Bernardino average. Large parks and connected paths provide safe, traffic-free routes for exercise.
Open land and scattered housing provide a semi-rural atmosphere that is slightly less dense than the San Bernardino average. According to iHuus data, the area features a mix of fields and woodland interspersed with residential clusters.
Diverse dining and local amenities provide more activity than the typical San Bernardino area, though some blocks remain quiet and residential. According to iHuus data, the neighborhood features a mix of lively commercial pockets and calm, green suburban spaces.
Frequent noise from nearby freeway and railroad corridors is common in this area. According to iHuus data, acoustic levels are notably higher than the San Bernardino average.
Air quality remains consistently high with very few health concerns. According to iHuus data, the air quality in this area is slightly better than the San Bernardino average.
Industrial presence is minimal within this area, which consists mainly of residential, medical, and park lands. According to iHuus data, this neighborhood is notably more free of warehouses and heavy industrial zones than the San Bernardino average.
Health insurance accessibility is lower than the San Bernardino average. According to iHuus data, fewer residents in this area possess comprehensive health coverage compared to the rest of the city.
Political leanings in this area are notably liberal, aligning closely with the broader trends seen across San Bernardino.
Residents live alongside a diverse range of age groups, including young adults, families, and older individuals. This demographic distribution is largely consistent with the broader San Bernardino area according to iHuus data.
Block-Level Insights for HI-30

iHuus Neighborhood Intelligence Insights
Get block-level neighborhood insights for HI-30
- Street-level scores — see how individual blocks compare, not just neighborhood averages
- Micro-zone boundaries — identify quiet pockets, flood boundaries, and walkable clusters before you visit
- 15 dimensions in full — walkability, noise, air quality, school quality, insurance coverage, population age profile, urban/rural index, and more
- Boundary risk alerts — know if your address sits near a block boundary where scores drop, the kind of detail no listing will ever mention
- School insights — individual school ratings and insights, not just district-level data
- Compare before you commit — side-by-side data across neighborhoods, down to block precision
No credit card required
Compare with Any Neighborhood
| Dimension | HI-30 | Alessandro |
|---|---|---|
| 🚶 Walkabilityavg 7.12 | ||
| 🔊 Acoustic Comfortavg 4.28 | ||
| 🤫 Privacy Indexavg 5.05 | ||
| 🎨 Visual Appealavg 5.64 | ||
| 🐕 Dog Friendlinessavg 5.15 | ||
| 🗺️ Urban-Rural Indexavg 6.67 | ||
| ✨ Neighborhood Vibeavg 4.38 | ||
| 🏥 Health Insurance Coverageavg 5.05 | ||
| 🌿 Air Qualityavg 9.16 | ||
| 🏭 Industrial Proximityavg 6.81 | ||
| 🌊 Flood Safetyavg 1.26 | ||
| 🗳️ Ideological Leanavg 8.58 | ||
| 👥 Population Age Profileavg 4.36 | ||
| 🔥 Fire Safetyavg 0.3 | ||
| 🏫 School Quality |
HI-30 Rankings
School Districts Serving HI-30
San Bernardino City Unified is a district in transition, characterized by a 'tale of two districts' where prestigious magnet programs and high-performing schools in the Highland area contrast sharply with a high volume of underperforming schools in impoverished sectors. While the district maintains financial stability through bond-funded facility upgrades and is aggressively expanding successful Career Technical Education (CTE) pathways, it is heavily burdened by significant safety concerns, teacher retention issues, and core math proficiency that lags state averages. The organization's health is currently moderate, buoyed by specialized successes but weighed down by systemic operational challenges and a portfolio where nearly one-third of the schools fall in the bottom tier of state ratings.
Schools
School Insights for HI-30
Below average outcomes; significant attendance and academic challenges.
School Insights
See what's really behind every school rating near HI-30
- Individual school ratings — each school's own score with outcome context, not just a district average
- Enrollment & class size data — student-to-teacher ratio and how it compares to the state average
- Full demographics breakdown — ethnicity and gender composition for every school in the enrollment zone
- Every school in the district — all schools within the enrollment boundary ranked by rating, not just the closest one
- Grade levels & benchmarks — elementary through high school, with below/above state-average flags
No credit card required