Pullman, Richmond
Updated · 2,494 residents
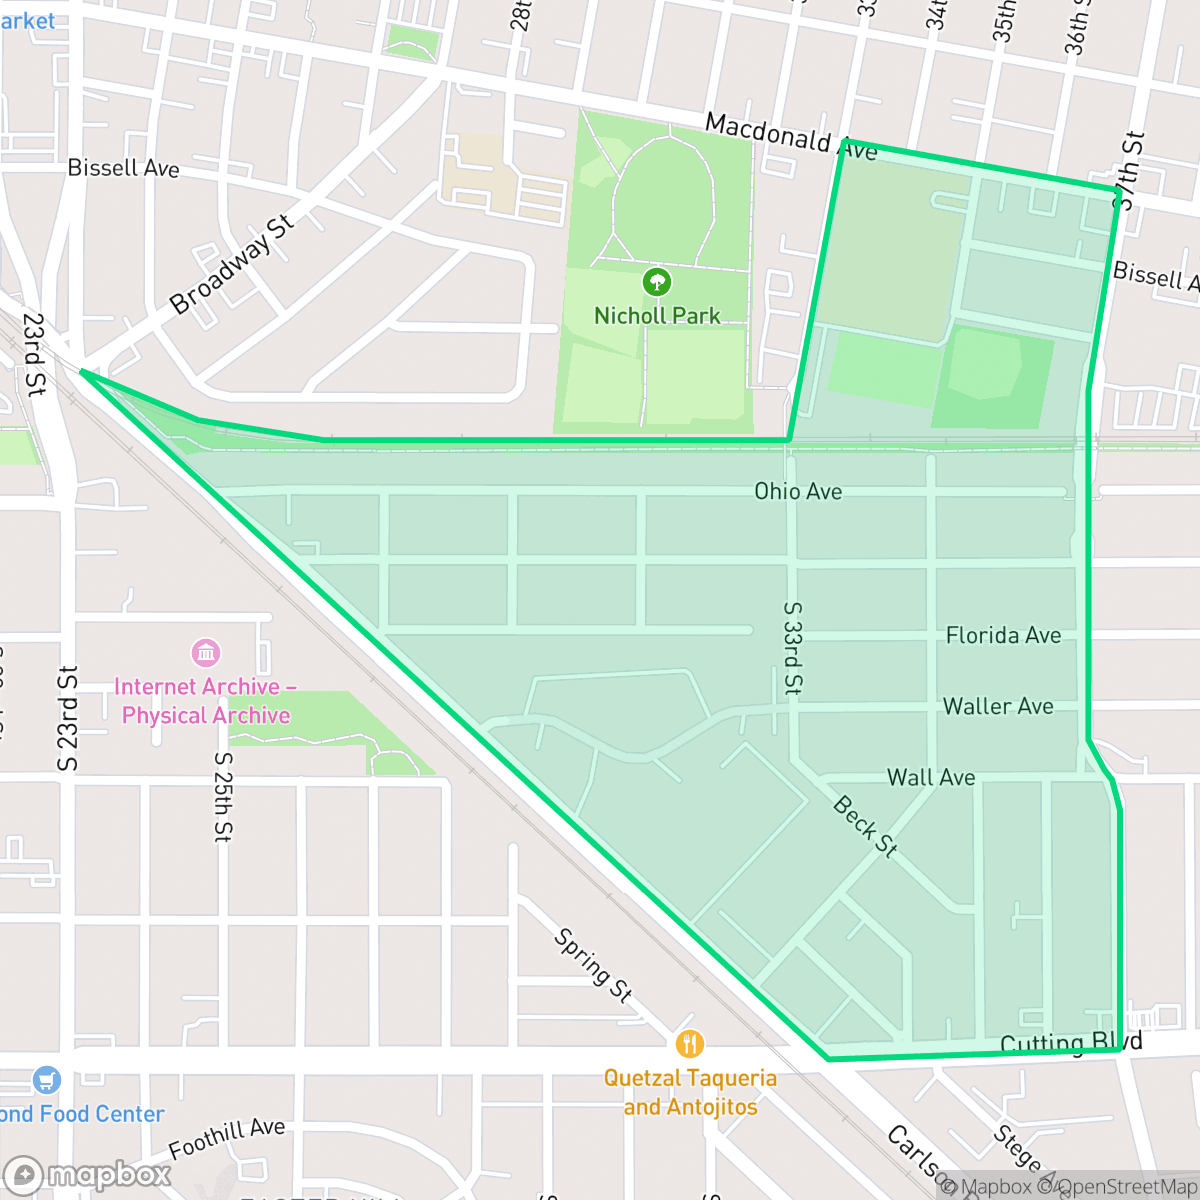
Pullman is a highly walkable, dense neighborhood in Richmond characterized by its industrial roots and a consistent grid layout. While residents benefit from easy access to local amenities, the area is notably loud due to heavy road traffic and its proximity to active industrial zones.
Key Highlights
About Pullman
The Pullman neighborhood in Richmond, California, originated around the 22-acre Pullman Company repair shops established in 1910. As the company's only facility west of the Mississippi, the shops serviced passenger equipment for major railroads. A bustling industrial suburb quickly grew around the plant, characterized by simple, single-story worker cottages, local businesses like the Pullman Grocery Company, and the neighborhood's first hotel built by contractor Lou Perisco. The local workforce, which included many African American laborers and Pullman porters, played a vital role in the community and early civil rights organizing through the Brotherhood of Sleeping Car Porters. Although the shops closed on December 31, 1959, and the area was later redeveloped with residential apartments, two of the original brick Pullman shop buildings still stand today at 350 Carlson Boulevard as historic landmarks.
The neighborhood maintains a dense, urban-suburban mix defined by its tight residential grids and proximity to large-scale commercial warehouses. The streetscape is highly walkable, with sidewalks lining both residential and commercial corridors, facilitating movement throughout the area. Local dining options, such as Boulevard Fish & Barbeque and Tacos Las Palmas, provide a modest selection of neighborhood-focused eateries within the immediate vicinity.
Prospective residents should note significant trade-offs regarding acoustic comfort and privacy, as average noise levels reach 66 decibels due to consistent road traffic. The area is situated near industrial sites, including an EPA Superfund location, which warrants consideration regarding environmental proximity. Additionally, the neighborhood is served by the West Contra Costa Unified School District, which faces ongoing challenges with academic performance and fiscal stability. The area is best suited for those prioritizing walkability and proximity to industrial employment hubs over quiet, low-density living.
Neighborhood Scores Across 15 Qualities
Residential structures are positioned in close proximity with minimal separation between homes. According to iHuus data, this level of density is higher than the Richmond average, often featuring shared walls or very narrow gaps between properties.
Pedestrian movement is highly efficient due to a consistent grid pattern with sidewalks on both sides of nearly every street and clear crosswalks. This level of walkability is notably higher than the Richmond average, according to iHuus data.
Uniform tract housing and apartment complexes characterize the area, featuring small yards and consistent architectural styles. This visual landscape is typical of the broader Richmond area.
Central public parks with large grass fields and walking paths offer good space for pets, though overall accessibility to green space is slightly below the Richmond average. According to iHuus data, while some housing complexes feature community lawns, much of the area's greenery is located in private backyards.
A dense combination of low-rise urban grids and large-scale industrial warehouses characterizes the area. According to iHuus data, this level of land development is roughly in line with the Richmond average.
A mix of industrial zones and residential pockets provides a level of activity that is higher than the Richmond average. While diverse dining options and green spaces are available, many businesses are not within easy walking distance.
Frequent sounds from nearby railroad tracks and heavy freeway traffic characterize the area. According to iHuus data, acoustic comfort in this neighborhood is lower than the Richmond average.
Air quality remains mostly clean with rare instances of elevated readings. This level of air purity is slightly higher than the Richmond average, according to iHuus data.
Residential pockets exist alongside active commercial zones and heavy industrial areas, which features more industrial density than the Richmond average. Proximity to rail corridors and a nearby Superfund site means some residents may experience increased freight traffic and environmental considerations.
Health insurance coverage is notably lower here than the Richmond city average, according to iHuus data. Residents may find fewer local options for employer-sponsored coverage compared to other parts of the city.
Voting patterns and census indicators show a deeply liberal political leaning, which is consistent with the broader Richmond area. According to iHuus data, this ideological profile is slightly more pronounced here than the city average.
Residents live alongside a balanced mix of young adults, families, and seniors. According to iHuus data, the age distribution is slightly more concentrated toward younger and middle-aged populations than the Richmond average.
Address-Level Insights for Pullman


iHuus Neighborhood Intelligence Insights
Get address-level neighborhood insights for Pullman
- Street-level scores — see how individual blocks compare, not just neighborhood averages
- Micro-zone boundaries — identify quiet pockets, flood boundaries, and walkable clusters before you visit
- 15 dimensions in full — walkability, noise, air quality, school quality, insurance coverage, population age profile, urban/rural index, and more
- Boundary risk alerts — know if your address sits near a block boundary where scores drop, the kind of detail no listing will ever mention
- School insights — individual school ratings and insights, not just district-level data
- Compare before you commit — side-by-side data across neighborhoods, down to block precision
No credit card required
Compare with Any Neighborhood
| Dimension | Pullman | Atchison Village |
|---|---|---|
| 🚶 Walkabilityavg 8.38 | ||
| 🔊 Acoustic Comfortavg 2.96 | ||
| 🤫 Privacy Indexavg 4.19 | ||
| 🎨 Visual Appealavg 5.97 | ||
| 🐕 Dog Friendlinessavg 6.4 | ||
| 🗺️ Urban-Rural Indexavg 6.62 | ||
| ✨ Neighborhood Vibeavg 4.2 | ||
| 🏥 Health Insurance Coverageavg 7.31 | ||
| 🌿 Air Qualityavg 8.35 | ||
| 🏭 Industrial Proximityavg 7.37 | ||
| 🌊 Flood Safetyavg 2.2 | ||
| 🗳️ Ideological Leanavg 9.87 | ||
| 👥 Population Age Profileavg 4.89 | ||
| 🔥 Fire Safetyavg 0.24 | ||
| 🏫 School Quality |
Pullman Rankings
School Districts Serving Pullman
School Insights for Pullman
Below average outcomes; significant attendance and academic challenges.
School Insights
See what's really behind every school rating near Pullman
- Individual school ratings — each school's own score with outcome context, not just a district average
- Enrollment & class size data — student-to-teacher ratio and how it compares to the state average
- Full demographics breakdown — ethnicity and gender composition for every school in the enrollment zone
- Every school in the district — all schools within the enrollment boundary ranked by rating, not just the closest one
- Grade levels & benchmarks — elementary through high school, with below/above state-average flags
No credit card required