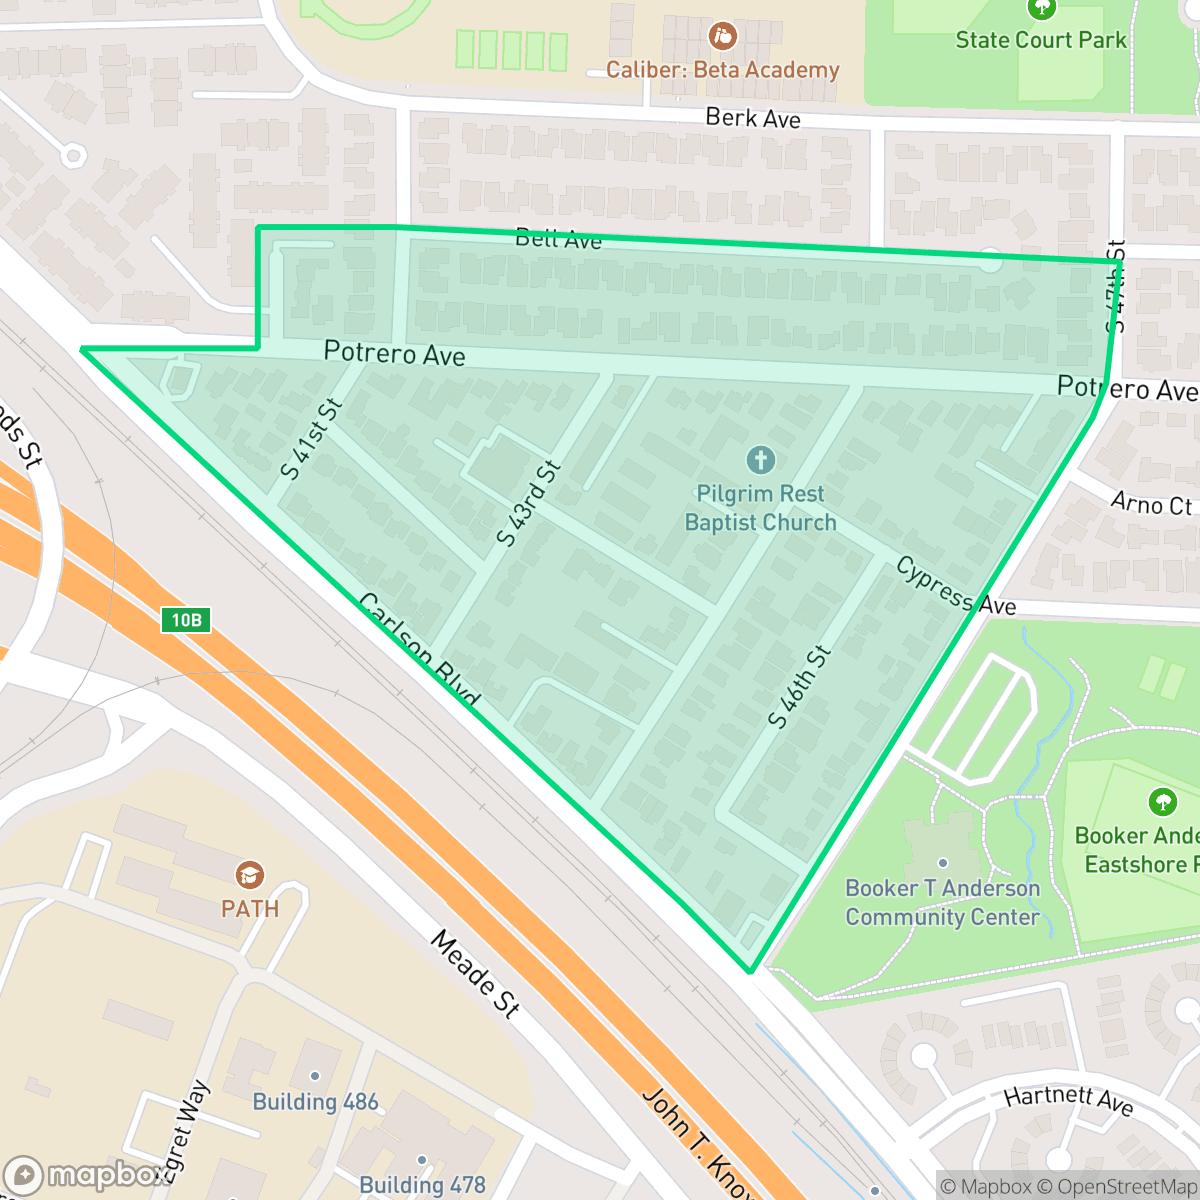
Eastshore, Richmond
Updated June 22, 2026 · 492 residents
Eastshore is a highly walkable, dense residential community in Richmond defined by its uniform suburban layout and proximity to public green spaces. While it offers excellent air quality and a quiet atmosphere, residents should be aware of significant road noise from nearby highways and the challenges facing the local school district.
Key Highlights
About Eastshore
The Eastshore neighborhood of Richmond, California, is deeply rooted in early 20th-century agricultural and wartime history. Beginning around 1909, Japanese-American families established prominent cut-flower businesses along South 47th Street, including the historic Oishi and Sakai nurseries. Despite their forced internment during World War II, many owners returned to successfully revive their operations. The neighborhood's cultural anchor is the 22-acre Booker T. Anderson, Jr. Park (originally established in 1914 as East Shore Park). During World War II, the city built a child-care center at the park to support women working in local defense plants. In 1972, the Eastshore Branch Library opened in the neighborhood's community center, which was later renamed alongside the park to honor civil rights activist, minister, and former Richmond mayor, Reverend Booker T. Anderson.
The area is characterized by a dense grid of single-family homes that prioritize pedestrian access, resulting in a high walkability score according to iHuus data. The neighborhood maintains a quiet, suburban rhythm, anchored by local institutions like the Pilgrim Rest Missionary Baptist Church and neighborhood parks that provide ample space for outdoor activities. The layout is consistent, featuring uniform rooflines and small lots that foster a close-knit, though privacy-limited, residential environment. Prospective residents should consider the trade-offs of living in this location, particularly regarding acoustic comfort, as road traffic contributes to elevated noise levels. While the neighborhood boasts exceptional air quality and a complete lack of heavy industrial proximity, the surrounding West Contra Costa Unified School District faces ongoing academic and financial instability. The area is best suited for those who prioritize neighborhood connectivity and outdoor access over absolute quiet or top-tier school ratings.
Neighborhood Scores Across 15 Qualities
Residential spacing is mixed, with some homes situated closely together along shared property lines. According to iHuus data, this level of privacy is slightly higher than the Richmond average.
Continuous sidewalk networks and safe crossings throughout the residential area make navigating the neighborhood easy on foot. While the street grid is highly accessible, walkability is slightly below the Richmond average.
Standard tract housing characterizes the area, featuring consistent rooflines and tidy but small yards. This visual profile is typical for the city of Richmond.
Large public parks and school sports fields offer ample green space for pets. According to iHuus data, the availability of connected paths and open areas is slightly above the Richmond city average.
Large-scale industrial warehouses and highway infrastructure sit alongside dense suburban residential clusters. According to iHuus data, this mix of built-up areas and open land is largely consistent with the broader Richmond area.
Low levels of commercial activity and a focus on industrial and warehouse use make this area feel more subdued than the Richmond average. Limited pedestrian-oriented businesses mean most daily needs require a car, though some green spaces and libraries are accessible on foot according to iHuus data.
Frequent loud disturbances from nearby airport runways and heavy rail lines create an environment with very low acoustic comfort. This level of noise is significantly higher than the average found throughout Richmond.
Air quality is exceptionally high and presents little to no health concern. According to iHuus data, the air quality in Eastshore is significantly better than the Richmond city average.
Residential areas and institutions dominate the landscape with very little heavy industry or large-scale warehousing visible. According to iHuus data, this neighborhood remains slightly more removed from industrial zones than the Richmond average.
Health insurance access among residents is relatively high and stays slightly above the Richmond city average, according to iHuus data.
Voting patterns and census indicators show a highly liberal political leaning that is slightly more pronounced than the Richmond city average, according to iHuus data.
Residents live alongside a diverse mix of young adults, families, and older populations. According to iHuus data, this age distribution is consistent with the broader Richmond area.
Significant flood risk exists due to the area being situated within a designated floodplain. According to iHuus data, this vulnerability is notably higher than the average for Richmond.
Block-Level Insights for Eastshore

iHuus Neighborhood Intelligence Insights
Get block-level neighborhood insights for Eastshore
- Street-level scores — see how individual blocks compare, not just neighborhood averages
- Micro-zone boundaries — identify quiet pockets, flood boundaries, and walkable clusters before you visit
- 15 dimensions in full — walkability, noise, air quality, school quality, insurance coverage, population age profile, urban/rural index, and more
- Boundary risk alerts — know if your address sits near a block boundary where scores drop, the kind of detail no listing will ever mention
- School insights — individual school ratings and insights, not just district-level data
- Compare before you commit — side-by-side data across neighborhoods, down to block precision
No credit card required
Compare with Any Neighborhood
| Dimension | Eastshore | Atchison Village |
|---|---|---|
| 🚶 Walkabilityavg 8.38 | ||
| 🔊 Acoustic Comfortavg 2.96 | ||
| 🤫 Privacy Indexavg 4.19 | ||
| 🎨 Visual Appealavg 5.97 | ||
| 🐕 Dog Friendlinessavg 6.4 | ||
| 🗺️ Urban-Rural Indexavg 6.62 | ||
| ✨ Neighborhood Vibeavg 4.2 | ||
| 🏥 Health Insurance Coverageavg 7.31 | ||
| 🌿 Air Qualityavg 8.35 | ||
| 🏭 Industrial Proximityavg 7.37 | ||
| 🌊 Flood Safetyavg 2.2 | ||
| 🗳️ Ideological Leanavg 9.87 | ||
| 👥 Population Age Profileavg 4.89 | ||
| 🔥 Fire Safetyavg 0.24 | ||
| 🏫 School Quality |
Eastshore Rankings
School Districts Serving Eastshore
West Contra Costa Unified is currently a distressed district characterized by a severe academic divide and significant financial instability. While a few schools in affluent areas maintain 10/10 ratings and high community engagement, the district's overall portfolio is dominated by underperforming schools, with a substantial portion of elementary and middle schools scoring 1/10 or 2/10. Recent reports of a multi-million dollar structural deficit, teacher strikes, and safety incidents at secondary campuses highlight a system under intense pressure. Despite strong career technical education pathways and a commitment to diversity, the district’s struggle to maintain fiscal solvency and close persistent achievement gaps suggests a fragile operational environment.
Schools
School Insights for Eastshore
Below average outcomes; significant attendance and academic challenges.
School Insights
See what's really behind every school rating near Eastshore
- Individual school ratings — each school's own score with outcome context, not just a district average
- Enrollment & class size data — student-to-teacher ratio and how it compares to the state average
- Full demographics breakdown — ethnicity and gender composition for every school in the enrollment zone
- Every school in the district — all schools within the enrollment boundary ranked by rating, not just the closest one
- Grade levels & benchmarks — elementary through high school, with below/above state-average flags
No credit card required