Riverside, San Angelo
Updated June 22, 2026 · 2,559 residents
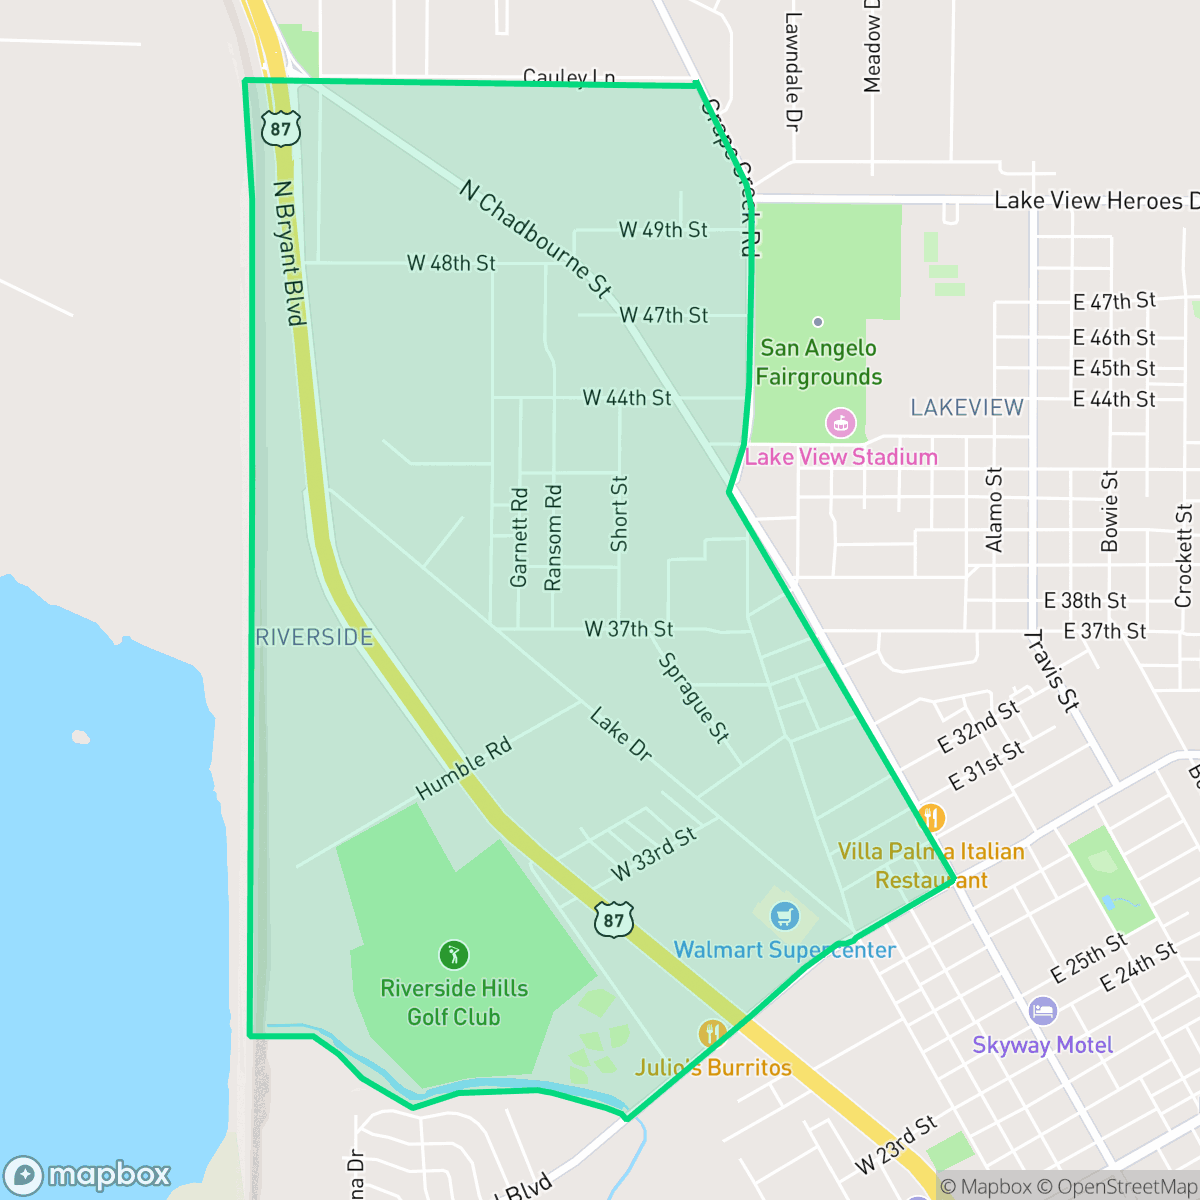
Riverside is a semi-rural neighborhood in San Angelo characterized by spacious residential lots and a quiet, sparse atmosphere. While the area offers pet-friendly paths and a peaceful environment away from industrial centers, residents should be aware of the high flood risk and limited walkability due to a lack of sidewalks.
Key Highlights
About Riverside
Riverside features a semi-rural landscape defined by open land and scattered homes, providing a significant degree of privacy compared to more urban parts of San Angelo. The neighborhood maintains a conservative-leaning community with a balanced mix of families, young adults, and older residents. While the area is largely quiet and free from industrial activity, it is subject to steady traffic noise from nearby thoroughfares. The streetscapes consist primarily of functional, standard housing with modest yards.
Prospective residents should note that the neighborhood has a high risk of flooding, which typically necessitates flood insurance. Additionally, pedestrian infrastructure is limited, as the area lacks sidewalks and is better suited for short, casual strolls than for navigating long distances on foot. Education options include the Grape Creek Independent School District, known for its community-centric approach and strong high school performance, and the San Angelo Independent School District, which is currently navigating consolidation and budget challenges. This area is best suited for those who prioritize privacy and a spacious, quiet environment over high-density social amenities.
Neighborhood Scores Across 15 Qualities
Residential lots feature significant separation between structures, providing more privacy than the typical San Angelo neighborhood. According to iHuus data, property spacing in Riverside is slightly higher than the city average.
Walking is possible along the quiet streets, but the lack of sidewalks makes it less pedestrian friendly than the San Angelo average. According to iHuus data, the area is better suited for short strolls rather than navigating long distances on foot.
Residential streetscapes consist primarily of standard tract housing with modest yards and simple rooflines. This level of visual variety is lower than the San Angelo city average.
Accessible green spaces and wide, low-traffic paths make this area slightly more accommodating for dog owners than the San Angelo average, according to iHuus data.
Frequent open land and scattered homes provide a more open, semi-rural atmosphere than the typical San Angelo residential area. According to iHuus data, the landscape features a low-density mix of residential plots, woodland, and industrial yards.
Low density and vast open spaces create a serene atmosphere with limited commercial activity. According to iHuus data, the area possesses a much lower level of social energy and business density than the San Angelo average.
Steady traffic noise from a nearby busy street characterizes the area. This level of acoustic activity is slightly higher than the San Angelo average, according to iHuus data.
Limited industrial activity defines this area, offering a quieter environment than much of San Angelo. Residents will find a primarily residential landscape with only occasional light commercial activity and no significant industrial hazards.
Health insurance coverage among Riverside residents is lower than the San Angelo average. This indicates a higher proportion of uninsured individuals living in the area according to iHuus data.
Voting patterns and census indicators reflect a conservative-leaning community, though this political profile is slightly less pronounced than the city average according to iHuus data.
Residents live alongside a balanced spread of young adults, families, and older individuals. This age distribution is slightly more varied than the average found across San Angelo.
Properties in this area are located within a designated flood zone, which typically necessitates flood insurance. This level of risk is consistent with the city average for San Angelo.
Block-Level Insights for Riverside

iHuus Neighborhood Intelligence Insights
Get block-level neighborhood insights for Riverside
- Street-level scores — see how individual blocks compare, not just neighborhood averages
- Micro-zone boundaries — identify quiet pockets, flood boundaries, and walkable clusters before you visit
- 15 dimensions in full — walkability, noise, air quality, school quality, insurance coverage, population age profile, urban/rural index, and more
- Boundary risk alerts — know if your address sits near a block boundary where scores drop, the kind of detail no listing will ever mention
- School insights — individual school ratings and insights, not just district-level data
- Compare before you commit — side-by-side data across neighborhoods, down to block precision
No credit card required
Compare with Any Neighborhood
| Dimension | Riverside | Angelo Heights |
|---|---|---|
| 🚶 Walkabilityavg 5.86 | ||
| 🔊 Acoustic Comfortavg 4.52 | ||
| 🤫 Privacy Indexavg 6.06 | ||
| 🎨 Visual Appealavg 5.61 | ||
| 🐕 Dog Friendlinessavg 5.82 | ||
| 🗺️ Urban-Rural Indexavg 7.3 | ||
| ✨ Neighborhood Vibeavg 4.15 | ||
| 🏥 Health Insurance Coverageavg 6.22 | ||
| 🌿 Air Quality | ||
| 🏭 Industrial Proximityavg 8.42 | ||
| 🌊 Flood Safetyavg 3.02 | ||
| 🗳️ Ideological Leanavg 1.23 | ||
| 👥 Population Age Profileavg 4.73 | ||
| 🔥 Fire Safety | ||
| 🏫 School Quality |
Riverside Rankings
School Districts Serving Riverside
Grape Creek Independent School District operates as a stable, community-centric organization characterized by a 'family-like' atmosphere and a standout high school performance (10/10), though it is currently hampered by mediocre feeder school metrics and aging infrastructure. While ground truth data reveals a sharp divide in academic ratings between the high school and lower grades, recent successful literacy initiatives and high engagement in vocational programs like FFA demonstrate a proactive administration. The district faces typical rural challenges, such as teacher turnover to larger neighboring districts and the need for facility bonds, placing it in the 'Mixed/Transition' category where strong community trust and high school success are balanced against foundational academic gaps.
Schools
San Angelo ISD is currently classified as a distressed district due to significant long-term enrollment decline and structural budget deficits that have necessitated controversial school closures. While the district maintains a solid 'C' rating with pockets of excellence in its top-tier elementary schools and successful bond-funded facility upgrades, the extreme performance gap between its highest and lowest-achieving campuses is concerning. Community trust is currently tested by transparency issues surrounding consolidation efforts and a shrinking student population that threatens future funding. Despite competitive teacher compensation plans and strong extracurricular successes, the district's operational health is strained by the need for aggressive rightsizing and stagnant secondary academic performance.
Schools
School Insights for Riverside
Below average outcomes; significant attendance and academic challenges.
School Insights
See what's really behind every school rating near Riverside
- Individual school ratings — each school's own score with outcome context, not just a district average
- Enrollment & class size data — student-to-teacher ratio and how it compares to the state average
- Full demographics breakdown — ethnicity and gender composition for every school in the enrollment zone
- Every school in the district — all schools within the enrollment boundary ranked by rating, not just the closest one
- Grade levels & benchmarks — elementary through high school, with below/above state-average flags
No credit card required