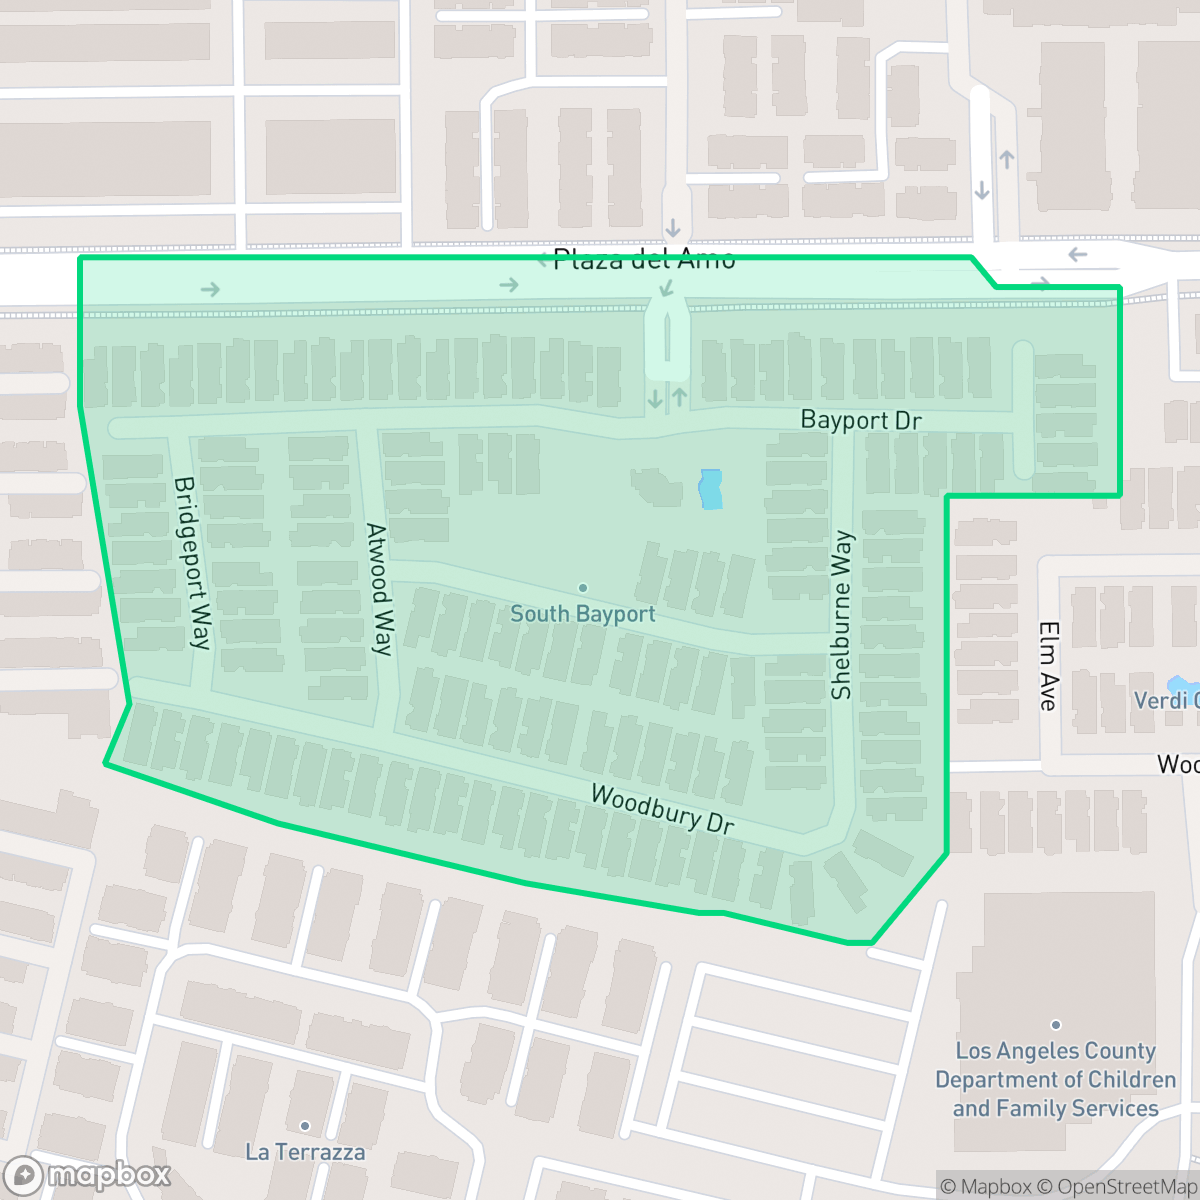
South Bayport, Torrance
Updated June 22, 2026 · 300 residents
South Bayport is a dense, highly walkable enclave in Torrance known for its proximity to local amenities and access to the top-rated Torrance Unified School District. While the area offers excellent pedestrian connectivity and dog-friendly green spaces, residents should expect a high-density suburban environment with significant ambient noise from nearby road traffic.
Key Highlights
About South Bayport
South Bayport is characterized by its compact urban-suburban mix, featuring a blend of multi-family apartment complexes and closely situated single-family homes. The neighborhood is defined by its exceptional walkability, providing residents with convenient access to nearby commercial hubs, including popular local dining spots and essential services. Its location within the highly regarded Torrance Unified School District makes it a stable choice for families seeking proximity to quality educational institutions and community resources.
Living in this area involves certain trade-offs, particularly regarding acoustic comfort and privacy. Due to the density of the housing and its proximity to major thoroughfares, the neighborhood experiences elevated noise levels from road traffic. While the area offers strong air quality and high rates of health insurance coverage, the tight configuration of homes results in limited individual privacy. It is best suited for those who prioritize pedestrian accessibility and school district quality over a quiet or secluded living environment.
Neighborhood Scores Across 15 Qualities
Residential spacing is somewhat compressed due to a mix of shared-wall townhomes and closely packed single-family homes. This density is slightly higher than the Torrance average, meaning neighbors are often in closer proximity.
Complete sidewalk networks and clear crosswalks at major intersections make navigating the area on foot easy. This level of pedestrian accessibility is even higher than the average for Torrance.
Tract housing and large apartment complexes characterize the landscape, which offers slightly less visual variety than the Torrance average. Residential lots feature tidy but modest yards and shared amenities like community pools.
Extensive sidewalks and access to a large public park with significant green space make this area notably more dog friendly than the Torrance average. Wide paths and connected open spaces provide safe routes for walking pets away from traffic.
A blend of multi-family apartments, commercial blocks, and single-family tracts defines the area. This level of development is consistent with the broader Torrance area.
Daily activity is relatively low, providing a calm atmosphere characterized by suburban streets and light industrial zones. While select amenities like local bakeries and coffee shops are accessible, the area offers less social energy than the Torrance average.
Constant noise from nearby airport runways and heavy transit infrastructure makes this area significantly louder than the Torrance average. Residents can expect frequent acoustic disruptions due to the immediate proximity to flight paths.
Air quality remains consistently high with rare instances of elevated readings. This level of cleanliness is slightly better than the Torrance city average, according to iHuus data.
Light industrial warehouses and utility structures with truck loading docks are located near residential areas. This presence of commercial zoning is lower than the Torrance city average, according to iHuus data.
Nearly all residents are covered by health insurance, a rate that is notably higher than the average for Torrance. This level of coverage provides significant stability for families and individuals in the area, according to iHuus data.
Political leanings in South Bayport trend toward the liberal side, appearing slightly more progressive than the Torrance city average according to iHuus data.
Residents live alongside a balanced mix of young adults, families, and older populations. This demographic spread is slightly more varied than the average seen across Torrance, according to iHuus data.
Flood safety levels in South Bayport are significantly higher than the Torrance average, though some residual risk remains due to proximity to a 500-year floodplain. Residents should account for occasional flood vulnerability according to iHuus data.
Block-Level Insights for South Bayport

iHuus Neighborhood Intelligence Insights
Get block-level neighborhood insights for South Bayport
- Street-level scores — see how individual blocks compare, not just neighborhood averages
- Micro-zone boundaries — identify quiet pockets, flood boundaries, and walkable clusters before you visit
- 15 dimensions in full — walkability, noise, air quality, school quality, insurance coverage, population age profile, urban/rural index, and more
- Boundary risk alerts — know if your address sits near a block boundary where scores drop, the kind of detail no listing will ever mention
- School insights — individual school ratings and insights, not just district-level data
- Compare before you commit — side-by-side data across neighborhoods, down to block precision
No credit card required
Compare with Any Neighborhood
| Dimension | South Bayport | Chatelaine |
|---|---|---|
| 🚶 Walkabilityavg 9.22 | ||
| 🔊 Acoustic Comfortavg 2.86 | ||
| 🤫 Privacy Indexavg 4.5 | ||
| 🎨 Visual Appealavg 6.49 | ||
| 🐕 Dog Friendlinessavg 5.97 | ||
| 🗺️ Urban-Rural Indexavg 6.5 | ||
| ✨ Neighborhood Vibeavg 4.9 | ||
| 🏥 Health Insurance Coverageavg 8.4 | ||
| 🌿 Air Qualityavg 7.82 | ||
| 🏭 Industrial Proximityavg 7.83 | ||
| 🌊 Flood Safetyavg 3.32 | ||
| 🗳️ Ideological Leanavg 7.66 | ||
| 👥 Population Age Profileavg 5.25 | ||
| 🔥 Fire Safetyavg 0.06 | ||
| 🏫 School Quality |
South Bayport Rankings
School Districts Serving South Bayport
Torrance Unified School District is a premier educational entity characterized by elite academic performance, high financial trust, and significant community investment. With high school graduation rates reaching 97% and a portfolio dominated by top-tier ratings, the district effectively prepares a diverse student body for university admission. Successful local bond measures have enabled critical technology and security upgrades, while the administration shows responsiveness to modern challenges through expanded mental health services. Despite the 'high pressure' environment typical of high-achieving districts and some performance variance in middle/elementary tiers, TUSD remains an exceptionally stable and high-quality organization that serves as a primary draw for residents in Southern California.
Schools
School Insights for South Bayport
Below average outcomes; significant attendance and academic challenges.
School Insights
See what's really behind every school rating near South Bayport
- Individual school ratings — each school's own score with outcome context, not just a district average
- Enrollment & class size data — student-to-teacher ratio and how it compares to the state average
- Full demographics breakdown — ethnicity and gender composition for every school in the enrollment zone
- Every school in the district — all schools within the enrollment boundary ranked by rating, not just the closest one
- Grade levels & benchmarks — elementary through high school, with below/above state-average flags
No credit card required