Lower East, Santa Barbara
Updated · 1,538 residents
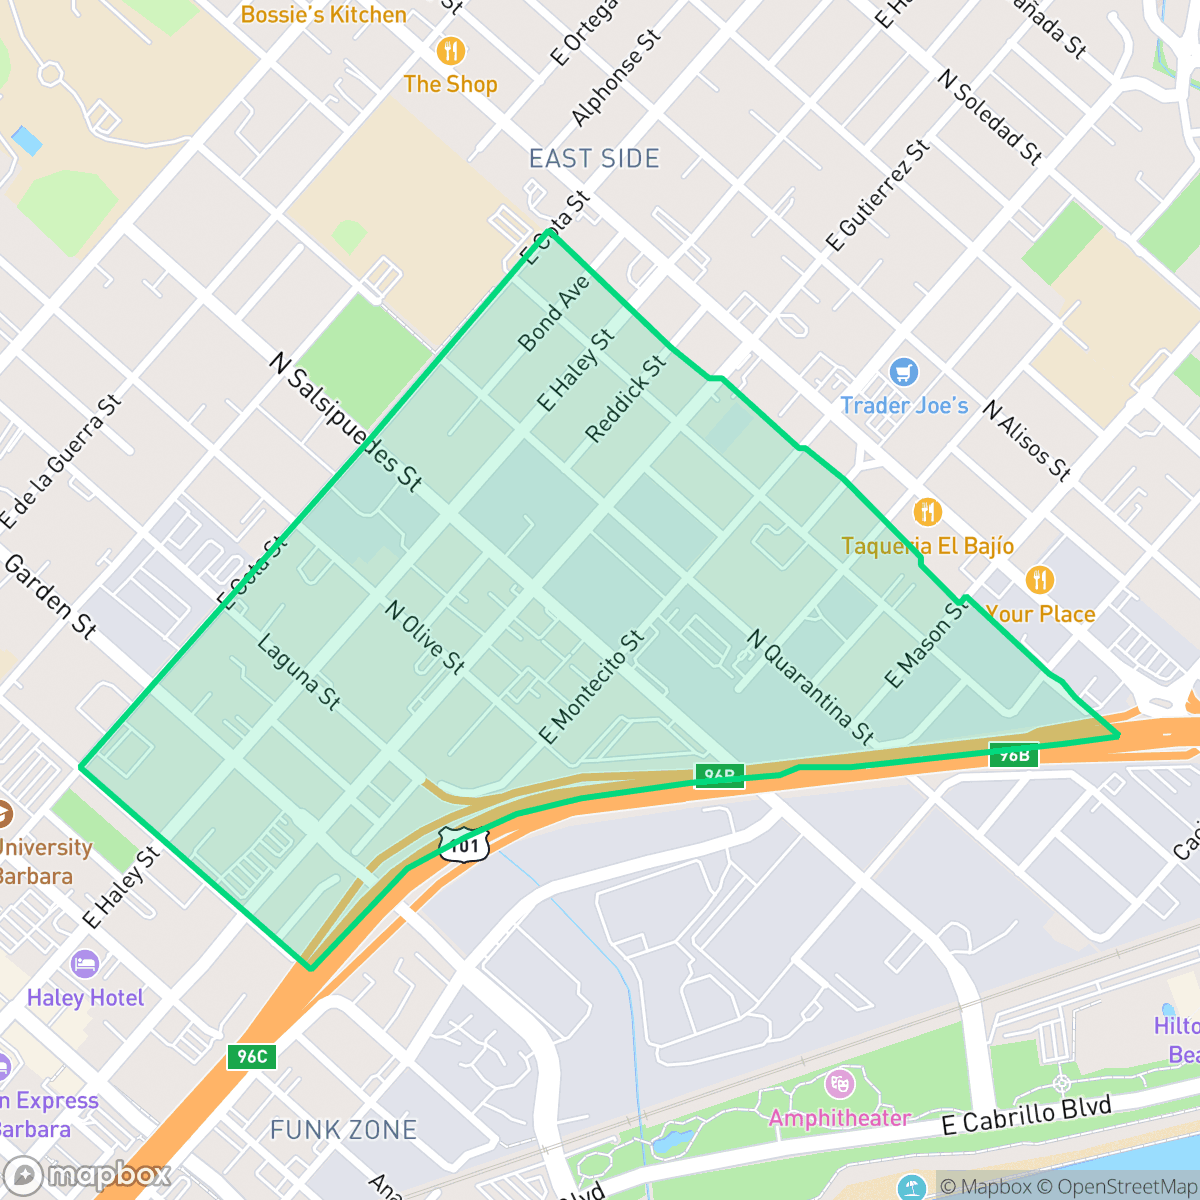
The Lower East side is defined by the vibrant Milpas Street commercial corridor and the iconic Santa Barbara Bowl. While the area offers excellent air quality and high health insurance coverage, residents should expect notable road noise and moderate walkability.
Key Highlights
About Lower East
The Lower Eastside of Santa Barbara was historically defined by its challenging geography, dominated in the 19th century by "el estero," a massive salt marsh that regularly flooded the low-lying basin. This marshy terrain inspired local street names like Salsipuedes (meaning "leave if you can"). Reclaimed in the late 1800s through drainage canals, the area transitioned into an agricultural park and later an industrial hub of lumber mills and warehouses. Due to early subdivision and discriminatory housing practices elsewhere, the Lower Eastside became a diverse, working-class enclave. By the 1920s and 1930s, it emerged as the cultural heart of Santa Barbara’s African American community, centered around businesses on East Haley Street. Today, the neighborhood maintains its distinct character, anchored by the bustling Milpas Street commercial corridor and the historic Santa Barbara Bowl.
The neighborhood functions as a central hub for Santa Barbara, characterized by a mix of residential streets and light industrial spaces. The presence of cultural venues and a diverse selection of local eateries contributes to a steady, active atmosphere. Residents benefit from high levels of health insurance coverage and pristine air quality, which distinguishes the area from more congested urban centers.
Prospective residents should weigh the neighborhood's central accessibility against specific environmental trade-offs. The area experiences significant road traffic noise, and the lower scores for flood and fire safety reflect the geographical challenges of the basin. It is best suited for those who prioritize proximity to local amenities and a strong sense of community over quiet, secluded living or high-end suburban amenities.
Neighborhood Scores Across 15 Qualities
Neighboring properties offer varying levels of separation, ranging from closely spaced homes to more detached dwellings in the hillside areas. According to iHuus data, privacy levels are slightly lower than the Santa Barbara average due to pockets of high-density housing.
Pedestrian access is supported by a consistent grid of sidewalks and safe crossings, though the area is slightly less walkable than the Santa Barbara average due to the presence of a major highway. Many local errands and park visits are easily completed on foot according to iHuus data.
Residential scenery ranges from modest suburban homes to larger estate-style properties in the northern hills; overall visual appeal sits below the Santa Barbara city average.
Dog walking options vary throughout the area, with some sections offering large public parks and ball fields while others feature narrow sidewalks and limited greenery. According to iHuus data, the availability of dedicated pet space is below the Santa Barbara average.
Scattered homes and frequent open spaces provide a more tranquil, less dense environment than the typical Santa Barbara urban core. This area features a mix of suburban residential lots and pockets of woodland that are less developed than the city average.
A steady rhythm of local eateries and galleries exists alongside calm residential streets, though the area offers less activity than the Santa Barbara average. According to iHuus data, the neighborhood provides a balanced atmosphere where suburban greenery meets light industrial and service-oriented pockets.
Frequent acoustic disturbances from nearby railroad tracks and heavy freeway traffic characterize this area. This level of noise is slightly higher than the Santa Barbara city average, according to iHuus data.
Air quality remains consistently high with minimal health concerns. This level of cleanliness is on par with the rest of Santa Barbara.
Primarily residential and light commercial in nature, this area avoids the heavy warehouse and trucking activity found further south of the highway. Residents experience a lack of significant industrial hazards, though the neighborhood has slightly more commercial presence than the Santa Barbara average.
Health insurance accessibility is notably lower than the Santa Barbara average. According to iHuus data, a minority of residents in this area possess comprehensive health coverage.
Voting patterns and census indicators reflect a deeply liberal political leaning that is slightly more pronounced than the Santa Barbara average, according to iHuus data.
Residents live alongside a varied demographic of young adults, families, and seniors. This age distribution is slightly more concentrated toward younger and middle-aged groups than the Santa Barbara average, according to iHuus data.
Flood vulnerability is significant in this area because it sits within a designated floodplain. According to iHuus data, this level of risk is substantially higher than the Santa Barbara city average.
Address-Level Insights for Lower East


iHuus Neighborhood Intelligence Insights
Get address-level neighborhood insights for Lower East
- Street-level scores — see how individual blocks compare, not just neighborhood averages
- Micro-zone boundaries — identify quiet pockets, flood boundaries, and walkable clusters before you visit
- 15 dimensions in full — walkability, noise, air quality, school quality, insurance coverage, population age profile, urban/rural index, and more
- Boundary risk alerts — know if your address sits near a block boundary where scores drop, the kind of detail no listing will ever mention
- School insights — individual school ratings and insights, not just district-level data
- Compare before you commit — side-by-side data across neighborhoods, down to block precision
No credit card required
Compare with Any Neighborhood
| Dimension | Lower East | Alta Mesa |
|---|---|---|
| 🚶 Walkabilityavg 8.12 | ||
| 🔊 Acoustic Comfortavg 3.7 | ||
| 🤫 Privacy Indexavg 5.66 | ||
| 🎨 Visual Appealavg 7.77 | ||
| 🐕 Dog Friendlinessavg 7.45 | ||
| 🗺️ Urban-Rural Indexavg 7.13 | ||
| ✨ Neighborhood Vibeavg 5.46 | ||
| 🏥 Health Insurance Coverageavg 6.92 | ||
| 🌿 Air Qualityavg 10 | ||
| 🏭 Industrial Proximityavg 9.73 | ||
| 🌊 Flood Safetyavg 3.72 | ||
| 🗳️ Ideological Leanavg 9.64 | ||
| 👥 Population Age Profileavg 5.23 | ||
| 🔥 Fire Safetyavg 0.32 | ||
| 🏫 School Quality |
Lower East Rankings
School Districts Serving Lower East
School Insights for Lower East
Below average outcomes; significant attendance and academic challenges.
School Insights
See what's really behind every school rating near Lower East
- Individual school ratings — each school's own score with outcome context, not just a district average
- Enrollment & class size data — student-to-teacher ratio and how it compares to the state average
- Full demographics breakdown — ethnicity and gender composition for every school in the enrollment zone
- Every school in the district — all schools within the enrollment boundary ranked by rating, not just the closest one
- Grade levels & benchmarks — elementary through high school, with below/above state-average flags
No credit card required