Little Italy, San Luis Obispo
Updated · 211 residents
Little Italy is a highly walkable neighborhood characterized by a semi-rural atmosphere and excellent air quality. While it offers exceptional access to outdoor spaces for pet owners, residents should be aware of significant aircraft noise and elevated flood risks associated with the area.
Key Highlights
About Little Italy
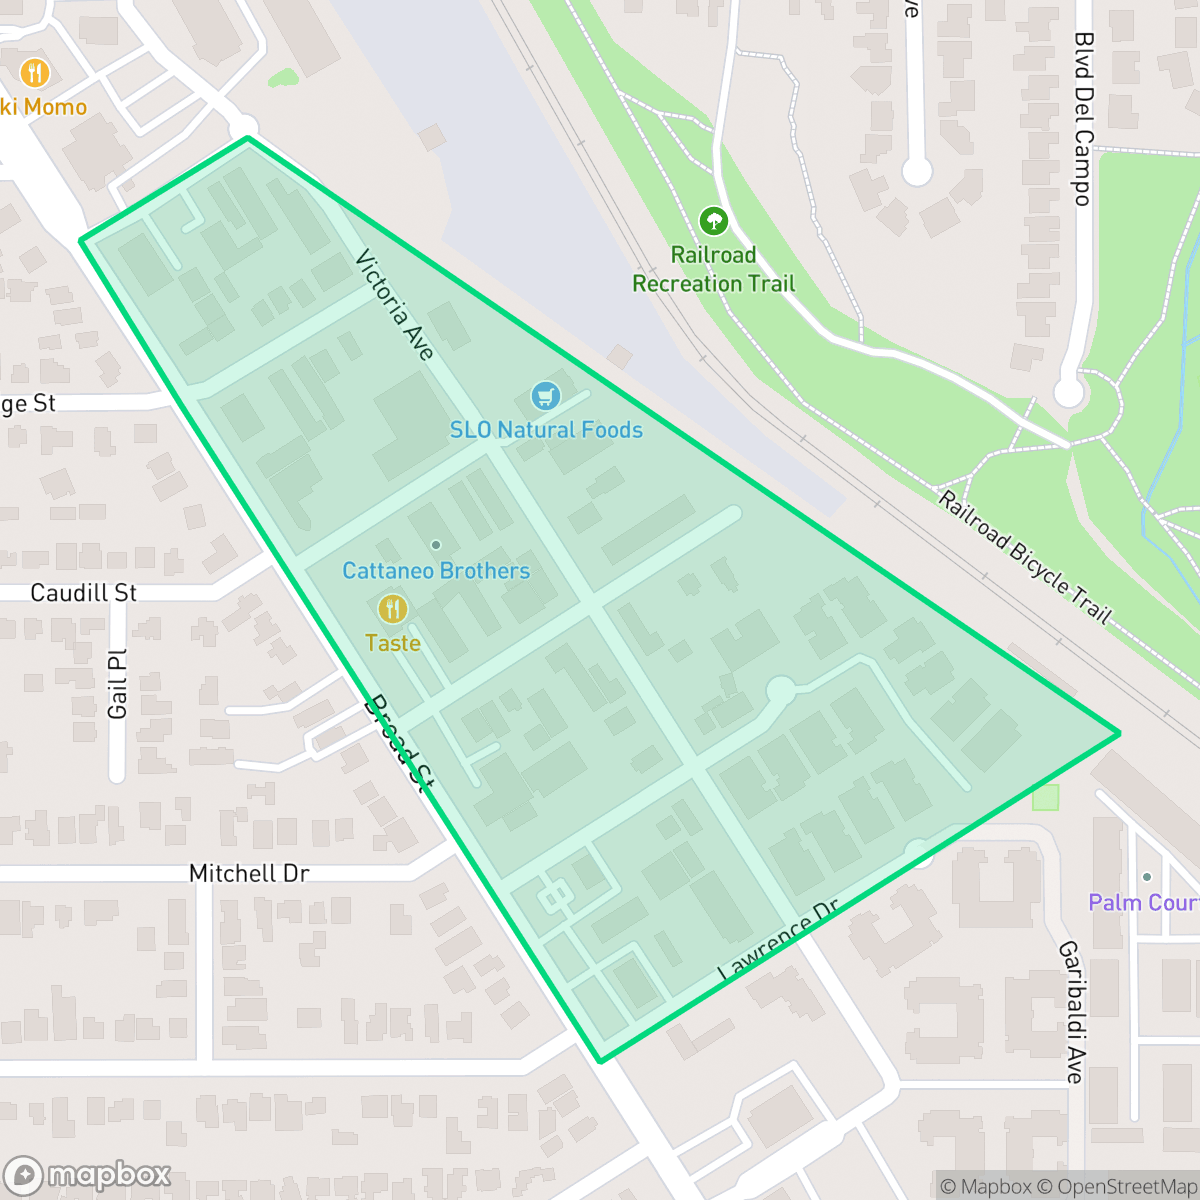
San Luis Obispo’s 'Little Italy' was a vibrant, close-knit enclave that thrived during the first half of the 20th century. Centered around a stretch of six streets—including Lawrence Drive, Humbert Avenue, and Francis Avenue—the neighborhood was home to many Italian immigrants, particularly those from the Canton Ticino region of Switzerland, who settled in the area in the late 1800s. Residents lived in modest frame houses near South Broad Street, maintaining a culture centered on hard work, traditional Italian food, and community feast days. While the neighborhood also included residents of Portuguese, Mexican, and Spanish descent, its distinct Italian identity began to wane by the 1940s and 1950s as younger generations assimilated and immigrant families dispersed throughout the city.
This neighborhood maintains a unique character where residential streets blend with light industrial and commercial activity. The landscape features traditional tract housing and generous open spaces, creating a semi-rural feel that appeals to a diverse mix of age groups. Residents benefit from superior pedestrian accessibility, making it easy to navigate the local area on foot. According to iHuus data, the area provides a moderate level of residential privacy, allowing for a comfortable balance between community interaction and personal space. The neighborhood presents specific livability trade-offs, including high noise levels due to its proximity to the airport runway and a notable vulnerability to flooding. Potential residents should also note that health insurance coverage rates are lower here compared to other parts of the city. Despite these factors, the community remains a strong, politically liberal enclave with access to the highly regarded San Luis Coastal Unified School District, which continues to provide robust academic opportunities despite recent fiscal adjustments.
Neighborhood Scores Across 15 Qualities
Residential spacing offers a moderate level of seclusion with some buffer between neighbors. This degree of privacy is slightly higher than the San Luis Obispo city average, according to iHuus data.
Pedestrian accessibility is exceptional due to wide sidewalks on both sides of the street and frequent crossings. This area offers superior walkability compared to the San Luis Obispo average, according to iHuus data.
Housing in this area consists of traditional tract homes with modest yards and simple rooflines. This visual profile is slightly below the San Luis Obispo city average.
Abundant large parks, trails, and open spaces provide exceptional opportunities for pet exercise. According to iHuus data, the level of access to these outdoor areas is significantly higher than the San Luis Obispo average.
Frequent open land and scattered homes amid woodland characterize this area. This landscape is slightly less developed than the typical San Luis Obispo neighborhood, according to iHuus data.
Social hubs and unique dining options provide pockets of activity, though the area's overall energy is slightly below the San Luis Obispo average. Resident experience varies between lively commercial blocks and quieter residential streets located near light industrial zones.
Frequent aircraft noise from the nearby airport runway is a constant presence. This level of acoustic disturbance is significantly higher than the average for San Luis Obispo.
Air quality in this area is excellent and matches the typical standards found throughout San Luis Obispo. Residents can expect very low levels of pollutants and minimal health concerns from local air particulates.
Residential life blends with active commercial daytime traffic, resulting in a higher presence of light industrial and commercial units than the San Luis Obispo average.
Health insurance enrollment among residents is notably lower than the San Luis Obispo city average, according to iHuus data.
Voting patterns and census indicators show a predominantly liberal political leaning that is more pronounced than the San Luis Obispo city average, according to iHuus data.
Residents live alongside a balanced blend of young adults, families, and older individuals. This demographic spread is consistent with the broader San Luis Obispo area, according to iHuus data.
Located within a coastal high-hazard zone, this area is subject to wave action and significantly higher flood vulnerability than the San Luis Obispo average. Residents should anticipate elevated or potentially prohibitive flood insurance costs according to iHuus data.
Address-Level Insights for Little Italy


iHuus Neighborhood Intelligence Insights
Get address-level neighborhood insights for Little Italy
- Street-level scores — see how individual blocks compare, not just neighborhood averages
- Micro-zone boundaries — identify quiet pockets, flood boundaries, and walkable clusters before you visit
- 15 dimensions in full — walkability, noise, air quality, school quality, insurance coverage, population age profile, urban/rural index, and more
- Boundary risk alerts — know if your address sits near a block boundary where scores drop, the kind of detail no listing will ever mention
- School insights — individual school ratings and insights, not just district-level data
- Compare before you commit — side-by-side data across neighborhoods, down to block precision
No credit card required
Compare with Any Neighborhood
| Dimension | Little Italy | Downtown |
|---|---|---|
| 🚶 Walkabilityavg 8.55 | ||
| 🔊 Acoustic Comfortavg 3.09 | ||
| 🤫 Privacy Indexavg 5.37 | ||
| 🎨 Visual Appealavg 6.61 | ||
| 🐕 Dog Friendlinessavg 8.17 | ||
| 🗺️ Urban-Rural Indexavg 7.06 | ||
| ✨ Neighborhood Vibeavg 6.03 | ||
| 🏥 Health Insurance Coverageavg 8.08 | ||
| 🌿 Air Qualityavg 9.99 | ||
| 🏭 Industrial Proximityavg 8.94 | ||
| 🌊 Flood Safetyavg 3.32 | ||
| 🗳️ Ideological Leanavg 9.27 | ||
| 👥 Population Age Profileavg 4.55 | ||
| 🔥 Fire Safetyavg 1.35 | ||
| 🏫 School Quality |
Little Italy Rankings
School Districts Serving Little Italy
School Insights for Little Italy
Below average outcomes; significant attendance and academic challenges.
School Insights
See what's really behind every school rating near Little Italy
- Individual school ratings — each school's own score with outcome context, not just a district average
- Enrollment & class size data — student-to-teacher ratio and how it compares to the state average
- Full demographics breakdown — ethnicity and gender composition for every school in the enrollment zone
- Every school in the district — all schools within the enrollment boundary ranked by rating, not just the closest one
- Grade levels & benchmarks — elementary through high school, with below/above state-average flags
No credit card required