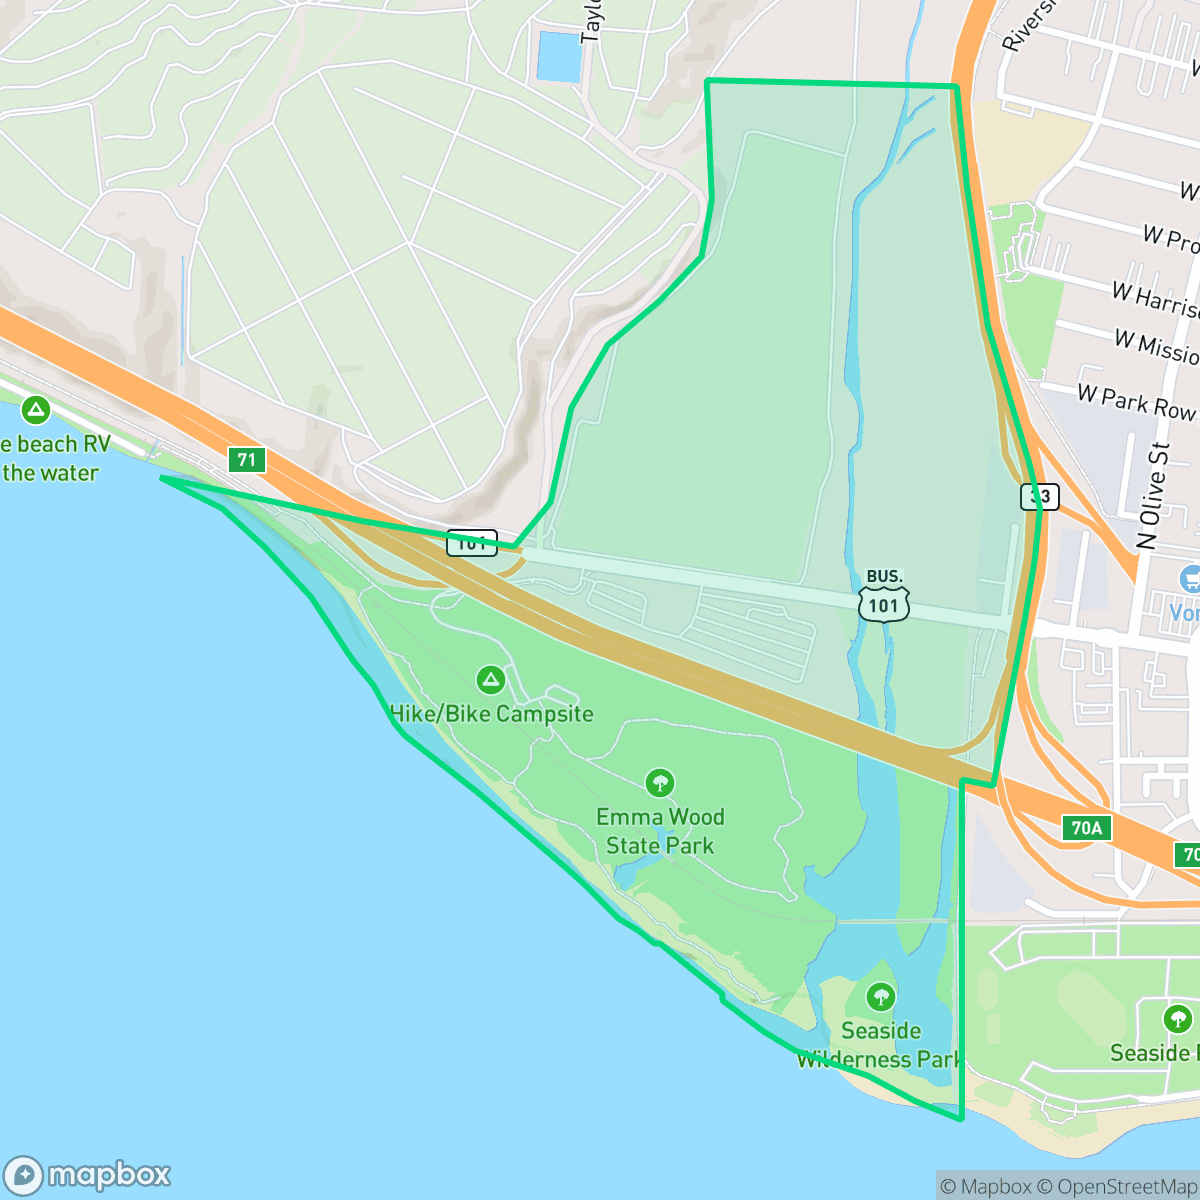
Ventura River, San Buenaventura (Ventura)
Updated June 22, 2026 · 502 residents
Ventura River is a quiet, mixed-use community characterized by its proximity to major transit routes and a blend of residential and commercial spaces. While the area offers excellent air quality, residents should be prepared for significant road noise and a high-risk environment regarding fire safety.
Key Highlights
About Ventura River
Ventura River functions as a compact, suburban-influenced neighborhood that blends residential life with active commercial corridors. Its location near major highways provides convenient access to local services like eateries and retail, though this proximity results in a notably high level of ambient road traffic noise. The area maintains a consistent, quiet atmosphere that appeals to those seeking a functional, no-frills environment.
Prospective residents should weigh the trade-offs of living in this specific part of San Buenaventura. While the neighborhood boasts high air quality and decent flood safety, it faces significant challenges including a high risk of fire and limited privacy due to its density. The local school district, Ventura Unified, is currently undergoing a period of structural and financial reorganization. This neighborhood is best suited for those who prioritize accessibility to regional transit and commercial conveniences over absolute acoustic tranquility or high-privacy settings.
Neighborhood Scores Across 15 Qualities
Residential spacing is somewhat tight, with some areas featuring houses positioned very close to one another. This level of density is slightly higher than the city average, according to iHuus data.
Pedestrian connectivity is exceptional due to a consistent grid system and wide sidewalks on both sides of nearly every street. This level of walkability is notably higher than the city average, providing ample crossings and dedicated pedestrian-priority areas.
Dense tract housing and apartment complexes define the area, featuring uniform rooflines and modest yards. The visual landscape is slightly less varied than the broader San Buenaventura average according to iHuus data.
Nearby riverbed trails and street-side greenery provide decent space for walking pets, though access to dedicated dog parks is slightly below the city average according to iHuus data.
Scattered homes sit among woodland and open fields, offering a setting that is slightly less dense than the typical Ventura urban landscape. According to iHuus data, the area maintains a balance of natural terrain and low-density residential pockets.
A steady rhythm of residential life and light industrial use defines the area. According to iHuus data, the neighborhood offers a tranquil atmosphere with access to local dining that is slightly more active than the city average.
Frequent noise from nearby railroad tracks and major freeway traffic makes this area significantly louder than the city average. According to iHuus data, residents can expect consistent acoustic disturbances from these transit corridors.
Air quality is consistently excellent, matching the high standard found across the rest of San Buenaventura. Residents can expect very minimal health concerns regarding local pollutants according to iHuus data.
Light industrial buildings and warehouses are located in the northern and eastern sectors, resulting in a higher presence of commercial activity than the Ventura average. Residents may encounter more daytime commercial traffic due to this blend of residential and utility-focused land use.
Health insurance coverage in this area is notably lower than the San Buenaventura average. According to iHuus data, a significant portion of the resident population remains uninsured.
Voting patterns and census indicators show a significantly more liberal leaning than the rest of San Buenaventura, according to iHuus data.
A varied mix of young adults, families, and seniors resides here, though the population skew is slightly lower than the Ventura city average according to iHuus data.
Residual flood risk exists within this area due to its location in the 500-year floodplain, though safety levels remain notably higher than the city average according to iHuus data.
Fire hazards are notably higher than the San Buenaventura average due to the surrounding vegetation. Residents should remain aware of standard local mitigation and seasonal precautions, according to iHuus data.
Block-Level Insights for Ventura River

iHuus Neighborhood Intelligence Insights
Get block-level neighborhood insights for Ventura River
- Street-level scores — see how individual blocks compare, not just neighborhood averages
- Micro-zone boundaries — identify quiet pockets, flood boundaries, and walkable clusters before you visit
- 15 dimensions in full — walkability, noise, air quality, school quality, insurance coverage, population age profile, urban/rural index, and more
- Boundary risk alerts — know if your address sits near a block boundary where scores drop, the kind of detail no listing will ever mention
- School insights — individual school ratings and insights, not just district-level data
- Compare before you commit — side-by-side data across neighborhoods, down to block precision
No credit card required
Compare with Any Neighborhood
| Dimension | Ventura River | Arundell |
|---|---|---|
| 🚶 Walkabilityavg 8.94 | ||
| 🔊 Acoustic Comfortavg 2.96 | ||
| 🤫 Privacy Indexavg 4.99 | ||
| 🎨 Visual Appealavg 6.55 | ||
| 🐕 Dog Friendlinessavg 6.7 | ||
| 🗺️ Urban-Rural Indexavg 6.9 | ||
| ✨ Neighborhood Vibeavg 4.55 | ||
| 🏥 Health Insurance Coverageavg 8.28 | ||
| 🌿 Air Qualityavg 9.98 | ||
| 🏭 Industrial Proximityavg 8.77 | ||
| 🌊 Flood Safetyavg 5.24 | ||
| 🗳️ Ideological Leanavg 8.09 | ||
| 👥 Population Age Profileavg 5.15 | ||
| 🔥 Fire Safetyavg 0.58 | ||
| 🏫 School Quality |
Ventura River Rankings
School Districts Serving Ventura River
Ventura Unified is a district in fiscal and structural transition, balancing high-performing flagship campuses with a portfolio of struggling elementary schools facing potential closure. Despite academic strengths—including an A-minus Niche rating and state recognition for attendance—the district is grappling with a persistent enrollment decline of 300 students per year and significant budget deficits that have necessitated staff cuts and surplus property sales. While terminal high schools like Foothill Technology and Ventura High remain stable 'destination' sites, the operational health is currently strained by labor negotiations and the socio-economic pressures of the California coast, placing the district in a state of high-stakes reorganization.
Schools
School Insights for Ventura River
Below average outcomes; significant attendance and academic challenges.
School Insights
See what's really behind every school rating near Ventura River
- Individual school ratings — each school's own score with outcome context, not just a district average
- Enrollment & class size data — student-to-teacher ratio and how it compares to the state average
- Full demographics breakdown — ethnicity and gender composition for every school in the enrollment zone
- Every school in the district — all schools within the enrollment boundary ranked by rating, not just the closest one
- Grade levels & benchmarks — elementary through high school, with below/above state-average flags
No credit card required