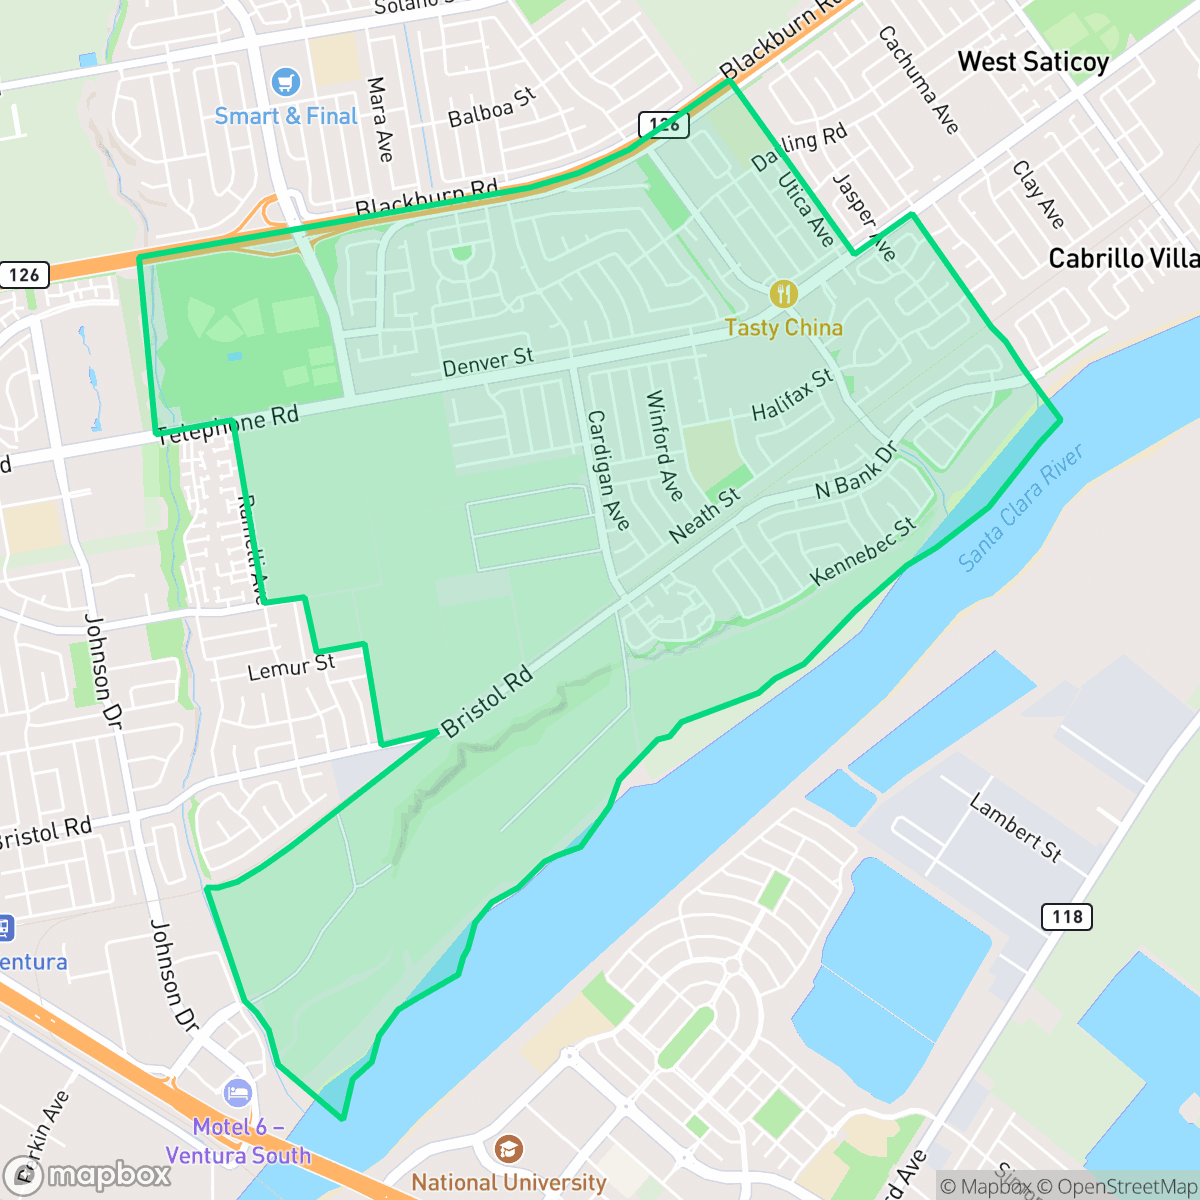
Serra, San Buenaventura (Ventura)
Updated June 22, 2026 · 12,022 residents
Serra is a quiet, highly walkable suburban neighborhood in Ventura characterized by uniform tract housing and proximity to open agricultural land. While residents enjoy excellent air quality and high health insurance coverage, the area experiences frequent noise from nearby railroad and freeway corridors.
Key Highlights
About Serra
The neighborhood offers a tranquil suburban environment defined by a mix of organized residential grids and nearby orchards. It is notable for its exceptional pedestrian infrastructure, which allows residents to navigate the area easily on continuous sidewalks. With a balanced demographic profile and a complete absence of industrial activity, the community maintains a consistent, peaceful character that appeals to those seeking a predictable and stable living environment according to iHuus data. The area is largely liberal in its political leanings and features a strong sense of community among its diverse, well-insured residents.
Living in this area involves specific trade-offs, particularly regarding environmental and acoustic factors. While the air quality is consistently high, the neighborhood faces a heightened risk of wildfire incidents, requiring residents to stay informed on local emergency protocols. Furthermore, the proximity to major transportation arteries results in persistent noise from train tracks and highways that is more noticeable than in other parts of the city. The area is best suited for individuals who prioritize walkability and access to open space over absolute quiet or architectural diversity.
Neighborhood Scores Across 15 Qualities
Residential spacing in Serra is slightly higher than the Ventura average, featuring a mix of closely packed suburban homes and shared-wall structures. According to iHuus data, neighbors are separated by varying distances that provide some buffer between properties.
Pedestrian infrastructure is exceptionally strong here, featuring continuous sidewalks on both sides of most streets and clear crossings. This network of paths and well-connected residential streets offers a level of walkability that is notably higher than the city average.
Standard tract housing and multi-family complexes define the landscape, featuring uniform rooflines and shared community pools. This residential aesthetic is slightly below the Ventura average for visual variety.
Continuous sidewalks and nearby green spaces provide reliable paths for exercise, though the area is slightly below the city average for dog friendliness. Access to the large riverbed area and neighborhood parks offers sufficient space for pets in many parts of the community.
Residential layouts consist of organized street grids and single-family homes situated near large agricultural fields and orchards. This landscape provides a balance of dense suburban development and open land that is very similar to the typical character found across Ventura.
Low-density residential pockets and rural landscapes define this area, which offers a more tranquil pace than the Ventura city average. While some walkable social spots exist near parks and railways, the neighborhood is characterized by significant open space and limited commercial density.
Frequent noise from nearby railroad tracks and major freeway corridors is a persistent feature of this area. According to iHuus data, acoustic levels in Serra are slightly more disruptive than the Ventura city average.
Air quality in Serra is excellent and matches the city average. Residents can expect consistently high air quality with minimal health concerns according to iHuus data.
Residential and agricultural landscapes dominate the area with an absence of warehouses or heavy industrial facilities. This lack of industrial activity is notably higher than the Ventura average, ensuring no nearby industrial hazards or large scale manufacturing sites.
Nearly all residents are covered by health insurance, which is a higher rate than the average seen across San Buenaventura. This level of coverage reflects a stable and well-protected community according to iHuus data.
Political leanings in Serra are predominantly liberal, though the neighborhood leans slightly less progressive than the broader San Buenaventura average according to iHuus data.
Residents experience a diverse demographic spread ranging from young adults to older populations. This age distribution is consistent with the broader Ventura area according to iHuus data.
Flood risk in this area is slightly higher than the Ventura average; however, precise risk levels remain undetermined due to incomplete federal studies. Residents should remain aware that current FEMA assessments lack a detailed flood study for this specific location.
Fire safety conditions in Serra are significantly lower than the city average, indicating a heightened risk of wildfire incidents. Residents should remain vigilant and follow local emergency protocols, according to iHuus data.
Block-Level Insights for Serra

iHuus Neighborhood Intelligence Insights
Get block-level neighborhood insights for Serra
- Street-level scores — see how individual blocks compare, not just neighborhood averages
- Micro-zone boundaries — identify quiet pockets, flood boundaries, and walkable clusters before you visit
- 15 dimensions in full — walkability, noise, air quality, school quality, insurance coverage, population age profile, urban/rural index, and more
- Boundary risk alerts — know if your address sits near a block boundary where scores drop, the kind of detail no listing will ever mention
- School insights — individual school ratings and insights, not just district-level data
- Compare before you commit — side-by-side data across neighborhoods, down to block precision
No credit card required
Compare with Any Neighborhood
| Dimension | Serra | Arundell |
|---|---|---|
| 🚶 Walkabilityavg 8.94 | ||
| 🔊 Acoustic Comfortavg 2.96 | ||
| 🤫 Privacy Indexavg 4.99 | ||
| 🎨 Visual Appealavg 6.55 | ||
| 🐕 Dog Friendlinessavg 6.7 | ||
| 🗺️ Urban-Rural Indexavg 6.9 | ||
| ✨ Neighborhood Vibeavg 4.55 | ||
| 🏥 Health Insurance Coverageavg 8.28 | ||
| 🌿 Air Qualityavg 9.98 | ||
| 🏭 Industrial Proximityavg 8.77 | ||
| 🌊 Flood Safetyavg 5.24 | ||
| 🗳️ Ideological Leanavg 8.09 | ||
| 👥 Population Age Profileavg 5.15 | ||
| 🔥 Fire Safetyavg 0.58 | ||
| 🏫 School Quality |
Serra Rankings
School Districts Serving Serra
Mesa Union Elementary School District is a solid, stable single-school district that exemplifies high-functioning small-town education in Ventura County. With academic proficiency rates in math and reading consistently outperforming state benchmarks and a prestigious 2026 county-wide Mock Trial victory, the district demonstrates a strong commitment to both core and extracurricular excellence. Operational health is reinforced by stable enrollment trends, proactive labor relations, and a 'Blue Chip' trajectory in community sentiment. While it lacks the 'Blue Ribbon' status required for a 5 rating, its fiscal transparency and 'whole child' educational model make it a premier choice in the region.
Schools
Oxnard Union High School District is a stable but bifurcated organization, exhibiting a 'Mixed/Transition' profile due to the stark contrast between its high-performing specialized academies and its struggling traditional high schools. While the district maintains strong community trust through successful bond measures and facility modernizations, its academic core is pressured by critically low math proficiency and a projected enrollment decline. Strong Career Technical Education programs and high graduation rates provide a floor for the district's quality, but significant achievement gaps across geographic lines and aging infrastructure on specific campuses remain primary obstacles to overall excellence.
Schools
Ventura Unified is a district in fiscal and structural transition, balancing high-performing flagship campuses with a portfolio of struggling elementary schools facing potential closure. Despite academic strengths—including an A-minus Niche rating and state recognition for attendance—the district is grappling with a persistent enrollment decline of 300 students per year and significant budget deficits that have necessitated staff cuts and surplus property sales. While terminal high schools like Foothill Technology and Ventura High remain stable 'destination' sites, the operational health is currently strained by labor negotiations and the socio-economic pressures of the California coast, placing the district in a state of high-stakes reorganization.
Schools
Rio Elementary School District is a distressed organization characterized by a severe performance gap between its flagship campus and the rest of the portfolio. While the district has successfully secured state grants for Community Schools initiatives and received praise for its STEAM and dual-immersion programs, these anecdotal 'wraparound' successes have yet to translate into core academic proficiency, with the majority of schools stagnant at the lowest state percentiles. Despite stable enrollment from new housing and positive community sentiment regarding staff dedication, the sheer volume of 1/10 and 2/10 school ratings, alongside significant infrastructure disparities between old and new sites, indicates a district struggling with systemic academic and operational consistency.
Schools
School Insights for Serra
Below average outcomes; significant attendance and academic challenges.
School Insights
See what's really behind every school rating near Serra
- Individual school ratings — each school's own score with outcome context, not just a district average
- Enrollment & class size data — student-to-teacher ratio and how it compares to the state average
- Full demographics breakdown — ethnicity and gender composition for every school in the enrollment zone
- Every school in the district — all schools within the enrollment boundary ranked by rating, not just the closest one
- Grade levels & benchmarks — elementary through high school, with below/above state-average flags
No credit card required