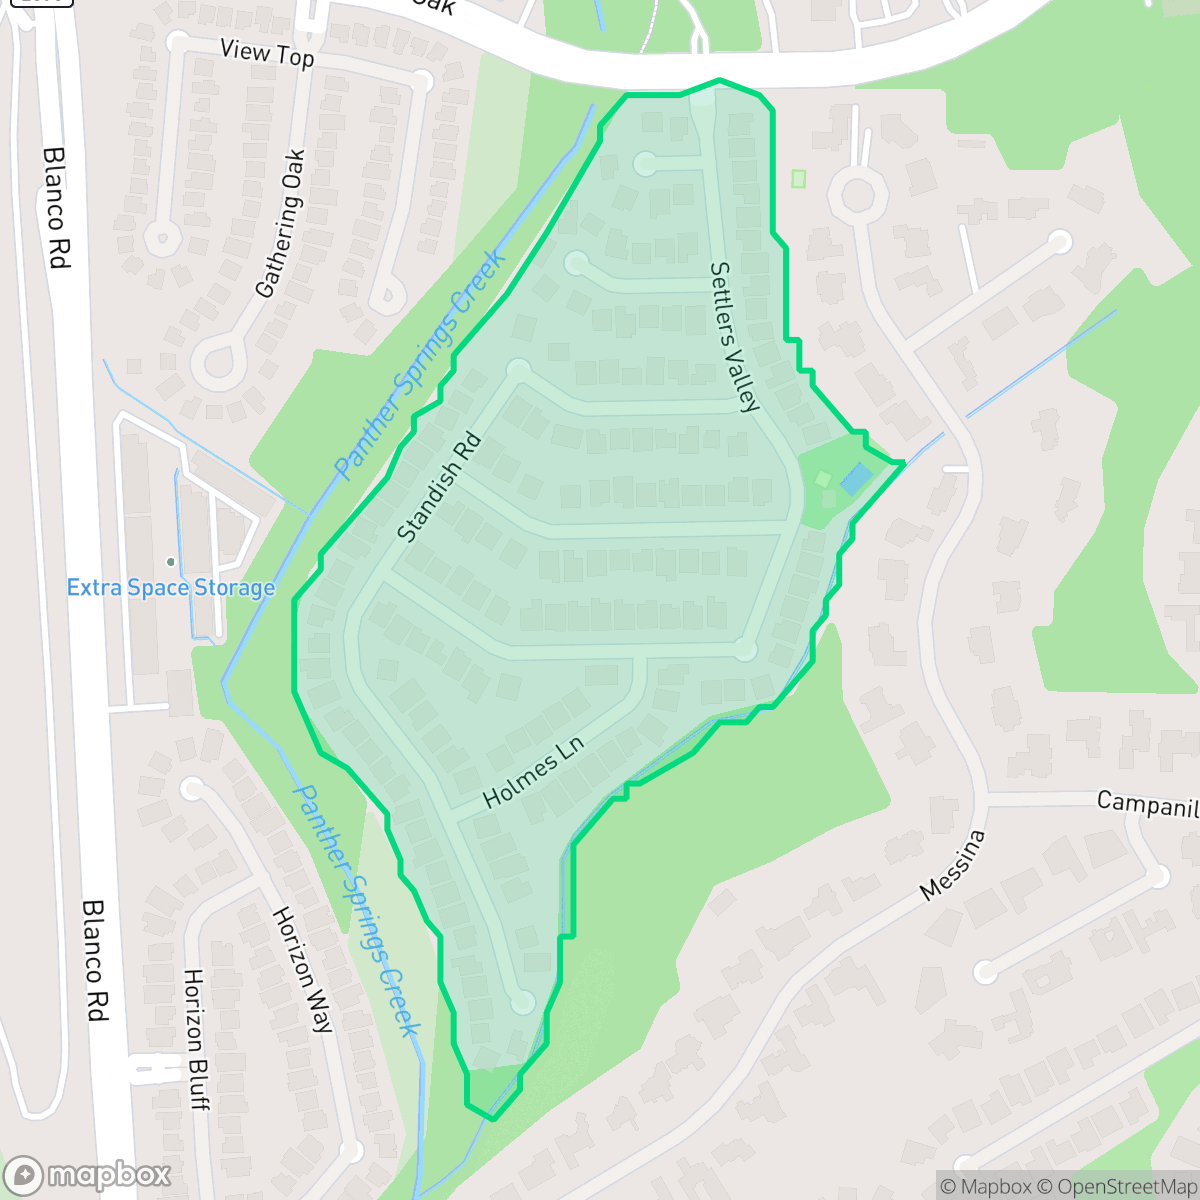
Stone Valley, San Antonio
Updated June 22, 2026 · 168 residents
Stone Valley is a quiet, suburban enclave in San Antonio known for its high walkability and scenic, green surroundings. While the area offers a peaceful residential environment away from industrial zones, residents typically rely on vehicles for most daily errands and routine services.
Key Highlights
About Stone Valley
This neighborhood is characterized by a tranquil atmosphere and a balanced mix of residential streets and natural greenery. According to iHuus data, the area maintains a high standard of visual appeal and is particularly welcoming to pet owners, offering a quiet retreat from the busier corridors of the city. While the local environment is serene, the low level of commercial activity means that most daily needs are met outside the immediate vicinity, necessitating a car for most errands.
The area is well-suited for those prioritizing acoustic comfort and safety, as it boasts strong flood resilience and minimal industrial proximity. Families benefit from access to the North East Independent School District, which is recognized for its academic stability and strong STEM programs. While the neighborhood lacks a high-energy nightlife, its stability and high rates of health insurance coverage make it an attractive option for residents seeking a predictable, low-stress living environment.
Neighborhood Scores Across 15 Qualities
Residential spacing provides some buffer between neighbors, offering a sense of privacy that is slightly higher than the San Antonio average.
Sidewalks and safe crossings are readily available for pedestrians. This level of accessibility is notably higher than the San Antonio average according to iHuus data.
Spacious driveways and large homes paired with frequent upscale amenities create a landscape that is significantly more visually appealing than the San Antonio average. According to iHuus data, the area features well-maintained residential properties and high-quality streetscapes.
Connected green spaces and wide, traffic-safe paths make this area more dog friendly than the San Antonio average, according to iHuus data.
Open land and scattered homes among woodlands define the landscape, providing a slightly more rural feel than the typical San Antonio area according to iHuus data.
Daily activities typically require a vehicle due to a low density of social hubs and a landscape that favors driving over walking. According to iHuus data, the area offers a serene, suburban rhythm that is less active than the San Antonio average.
Steady traffic noise from a nearby busy street is present, though the acoustic environment remains more tranquil than the San Antonio average according to iHuus data.
Air quality in this area presents a mix of acceptable and unhealthy days, though it remains notably better than the San Antonio average. Sensitive groups may experience occasional concern during certain periods according to iHuus data.
No warehouses, industrial facilities, or hazard sites are present in this area. This neighborhood features a strictly residential landscape with open green spaces, which is notably more free of industrial activity than the San Antonio average.
Health insurance access among Stone Valley residents is higher than the San Antonio average, according to iHuus data.
Political leanings in this area trend significantly more conservative than the San Antonio average. Residents will find a notable conservative majority with a smaller presence of opposing viewpoints, according to iHuus data.
Demographics in Stone Valley lean toward an older population compared to the San Antonio average. This profile suggests a community with a higher concentration of established residents and fewer young adults than other parts of the city.
Flood risk levels in Stone Valley are notably higher than the San Antonio average due to its location within a 500-year floodplain. Some residual flood risk remains present, according to iHuus data.
Block-Level Insights for Stone Valley

iHuus Neighborhood Intelligence Insights
Get block-level neighborhood insights for Stone Valley
- Street-level scores — see how individual blocks compare, not just neighborhood averages
- Micro-zone boundaries — identify quiet pockets, flood boundaries, and walkable clusters before you visit
- 15 dimensions in full — walkability, noise, air quality, school quality, insurance coverage, population age profile, urban/rural index, and more
- Boundary risk alerts — know if your address sits near a block boundary where scores drop, the kind of detail no listing will ever mention
- School insights — individual school ratings and insights, not just district-level data
- Compare before you commit — side-by-side data across neighborhoods, down to block precision
No credit card required
Compare with Any Neighborhood
| Dimension | Stone Valley | 145 Association |
|---|---|---|
| 🚶 Walkabilityavg 6.44 | ||
| 🔊 Acoustic Comfortavg 4.07 | ||
| 🤫 Privacy Indexavg 5.75 | ||
| 🎨 Visual Appealavg 6.11 | ||
| 🐕 Dog Friendlinessavg 5.91 | ||
| 🗺️ Urban-Rural Indexavg 6.87 | ||
| ✨ Neighborhood Vibeavg 4.35 | ||
| 🏥 Health Insurance Coverageavg 5.94 | ||
| 🌿 Air Qualityavg 2.27 | ||
| 🏭 Industrial Proximityavg 8.31 | ||
| 🌊 Flood Safetyavg 4.2 | ||
| 🗳️ Ideological Leanavg 7.37 | ||
| 👥 Population Age Profileavg 4.68 | ||
| 🔥 Fire Safety | ||
| 🏫 School Quality |
Stone Valley Rankings
School Districts Serving Stone Valley
NEISD is a high-performing, stable 'Blue Chip' district that currently maintains an overall 'A' grade and excellent college readiness metrics despite significant financial pressures. While it boasts elite flagship high schools and nationally recognized fine arts and STEM programs, the district is navigating a multi-million dollar budget deficit and a growing resource divide between its affluent northern corridors and older central campuses. Community trust remains generally high, supported by proactive security measures and a commitment to teacher retention, though ongoing debates over board governance and fiscal 'right-sizing' signal a period of transition that requires careful monitoring.
Schools
School Insights for Stone Valley
Below average outcomes; significant attendance and academic challenges.
School Insights
See what's really behind every school rating near Stone Valley
- Individual school ratings — each school's own score with outcome context, not just a district average
- Enrollment & class size data — student-to-teacher ratio and how it compares to the state average
- Full demographics breakdown — ethnicity and gender composition for every school in the enrollment zone
- Every school in the district — all schools within the enrollment boundary ranked by rating, not just the closest one
- Grade levels & benchmarks — elementary through high school, with below/above state-average flags
No credit card required