Sonterra Villas Townhome Condominium-Sonterra-Stone Oak, San Antonio
Updated June 22, 2026 · 11 residents
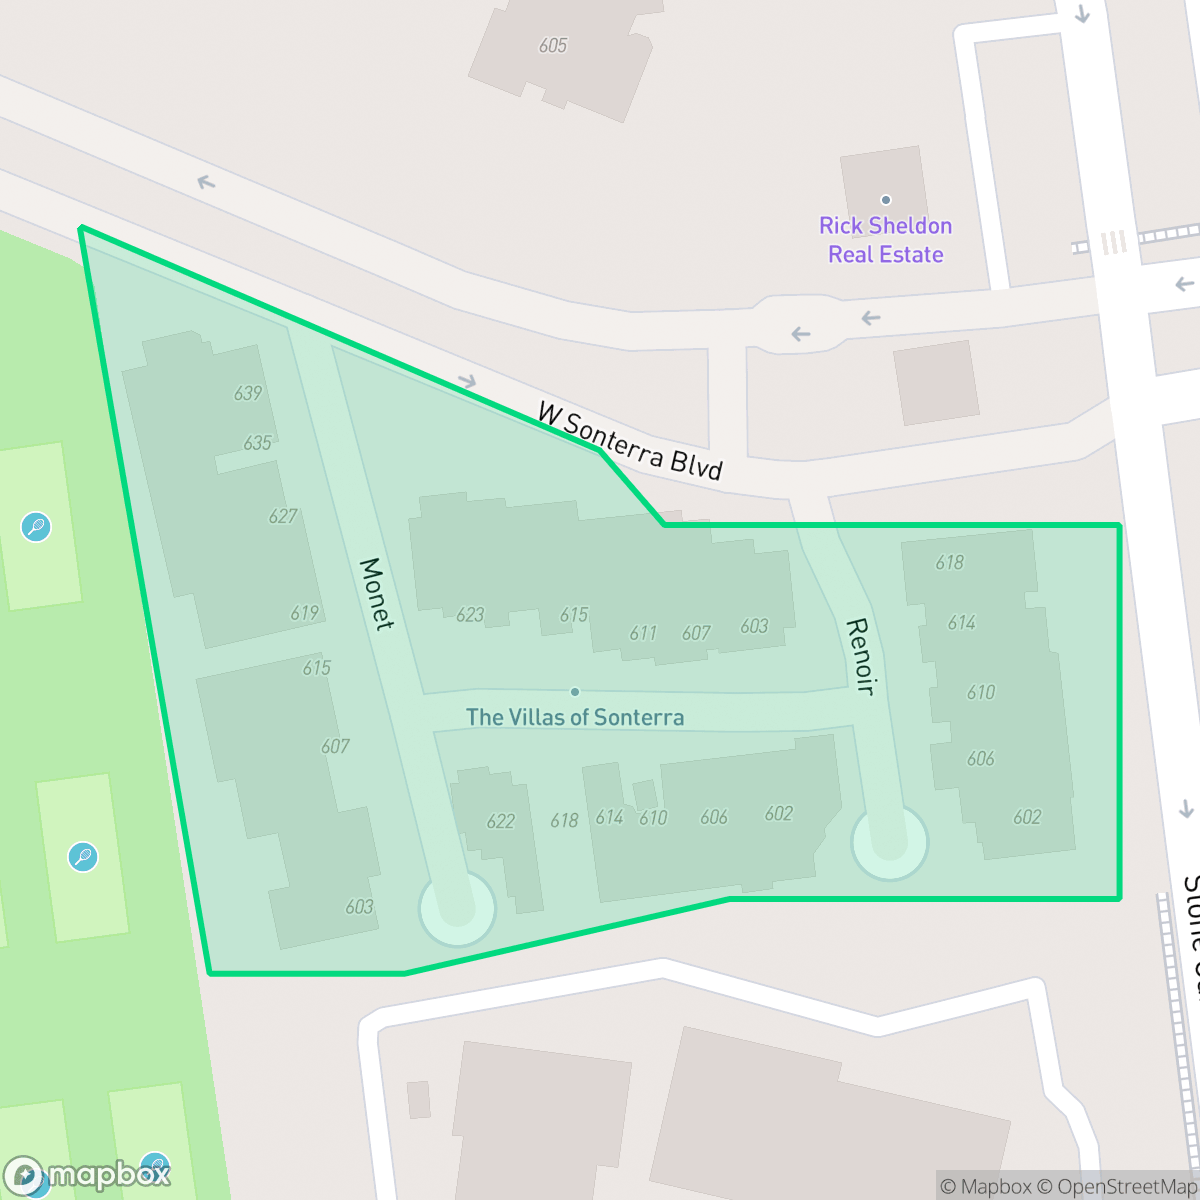
Sonterra Villas Townhome Condominium is a visually striking residential enclave located in the heart of the Stone Oak area of San Antonio. While the neighborhood offers exceptional visual appeal and is highly pet-friendly, residents should be prepared for significant noise levels stemming from nearby highway traffic.
Key Highlights
About Sonterra Villas Townhome Condominium-Sonterra-Stone Oak
Part of the broader Stone Oak community, this neighborhood is defined by its well-maintained townhome architecture and aesthetic appeal. It sits in a high-energy suburban setting that provides convenient access to local dining and retail corridors, including popular options such as Torchy's Tacos and Tarka Indian Kitchen. According to iHuus data, the area is characterized by its residential focus and proximity to open green spaces, creating a distinct visual environment that stands out within the city.
Living in this area involves clear trade-offs, particularly regarding acoustic comfort, as the neighborhood experiences elevated noise levels from surrounding road traffic. While it offers a solid sense of community and is well-positioned for those who prioritize aesthetic surroundings and proximity to North East Independent School District schools, it remains a car-dependent environment. It is best suited for residents who value a modern, visually cohesive living space and are comfortable with the suburban pace of life found in northern San Antonio.
Neighborhood Scores Across 15 Qualities
Residential spacing is slightly higher than the San Antonio average, providing some buffer between adjacent homes. Neighbors are situated with moderate density and mixed spacing according to iHuus data.
Sidewalks are available on one side of the streets with safe crossings provided. This area is more walkable than the San Antonio average, according to iHuus data.
Large homes, frequent upscale amenities, and spacious driveways contribute to a landscape that is noticeably more aesthetically pleasing than the San Antonio average. According to iHuus data, the area features a well-maintained and high-quality visual environment.
Connected green spaces and wide, traffic-safe paths make this area significantly more dog-friendly than the San Antonio average, according to iHuus data.
Scattered homes and frequent open land characterize this area, which feels slightly more open and less dense than the San Antonio average according to iHuus data.
Diverse dining options and accessible green spaces create a lively atmosphere that is significantly more active than the San Antonio average. Residents have access to a variety of local eateries, though the area remains primarily car dependent according to iHuus data.
Frequent noise from nearby major transit corridors is a notable feature of this area. According to iHuus data, acoustic levels are significantly higher than the San Antonio average.
Unhealthy air quality levels occur frequently in this area, posing a significant risk to sensitive groups. According to iHuus data, air quality here is slightly worse than the San Antonio average.
Industrial activity and heavy warehouses are entirely absent from this area, providing a quiet environment that is significantly cleaner of industrial presence than the San Antonio average.
Health insurance enrollment among residents is roughly in line with the San Antonio average, according to iHuus data.
Conservative viewpoints represent a majority of the population here, which is notably more conservative than the San Antonio average according to iHuus data.
Residents experience a balanced demographic mix of young adults, families, and seniors, which is more varied than the average San Antonio population according to iHuus data.
Flood safety in this area is significantly higher than the San Antonio average. While some residual risk exists within the 500-year floodplain, according to iHuus data, the location remains well outside primary flood zones.
Block-Level Insights for Sonterra Villas Townhome Condominium-Sonterra-Stone Oak

iHuus Neighborhood Intelligence Insights
Get block-level neighborhood insights for Sonterra Villas Townhome Condominium-Sonterra-Stone Oak
- Street-level scores — see how individual blocks compare, not just neighborhood averages
- Micro-zone boundaries — identify quiet pockets, flood boundaries, and walkable clusters before you visit
- 15 dimensions in full — walkability, noise, air quality, school quality, insurance coverage, population age profile, urban/rural index, and more
- Boundary risk alerts — know if your address sits near a block boundary where scores drop, the kind of detail no listing will ever mention
- School insights — individual school ratings and insights, not just district-level data
- Compare before you commit — side-by-side data across neighborhoods, down to block precision
No credit card required
Compare with Any Neighborhood
| Dimension | Sonterra Villas Townhome Condominium-Sonterra-Stone Oak | 145 Association |
|---|---|---|
| 🚶 Walkabilityavg 6.44 | ||
| 🔊 Acoustic Comfortavg 4.07 | ||
| 🤫 Privacy Indexavg 5.75 | ||
| 🎨 Visual Appealavg 6.11 | ||
| 🐕 Dog Friendlinessavg 5.91 | ||
| 🗺️ Urban-Rural Indexavg 6.87 | ||
| ✨ Neighborhood Vibeavg 4.35 | ||
| 🏥 Health Insurance Coverageavg 5.94 | ||
| 🌿 Air Qualityavg 2.27 | ||
| 🏭 Industrial Proximityavg 8.31 | ||
| 🌊 Flood Safetyavg 4.2 | ||
| 🗳️ Ideological Leanavg 7.37 | ||
| 👥 Population Age Profileavg 4.68 | ||
| 🔥 Fire Safety | ||
| 🏫 School Quality |
Sonterra Villas Townhome Condominium-Sonterra-Stone Oak Rankings
School Districts Serving Sonterra Villas Townhome Condominium-Sonterra-Stone Oak
NEISD is a high-performing, stable 'Blue Chip' district that currently maintains an overall 'A' grade and excellent college readiness metrics despite significant financial pressures. While it boasts elite flagship high schools and nationally recognized fine arts and STEM programs, the district is navigating a multi-million dollar budget deficit and a growing resource divide between its affluent northern corridors and older central campuses. Community trust remains generally high, supported by proactive security measures and a commitment to teacher retention, though ongoing debates over board governance and fiscal 'right-sizing' signal a period of transition that requires careful monitoring.
Schools
School Insights for Sonterra Villas Townhome Condominium-Sonterra-Stone Oak
Below average outcomes; significant attendance and academic challenges.
School Insights
See what's really behind every school rating near Sonterra Villas Townhome Condominium-Sonterra-Stone Oak
- Individual school ratings — each school's own score with outcome context, not just a district average
- Enrollment & class size data — student-to-teacher ratio and how it compares to the state average
- Full demographics breakdown — ethnicity and gender composition for every school in the enrollment zone
- Every school in the district — all schools within the enrollment boundary ranked by rating, not just the closest one
- Grade levels & benchmarks — elementary through high school, with below/above state-average flags
No credit card required