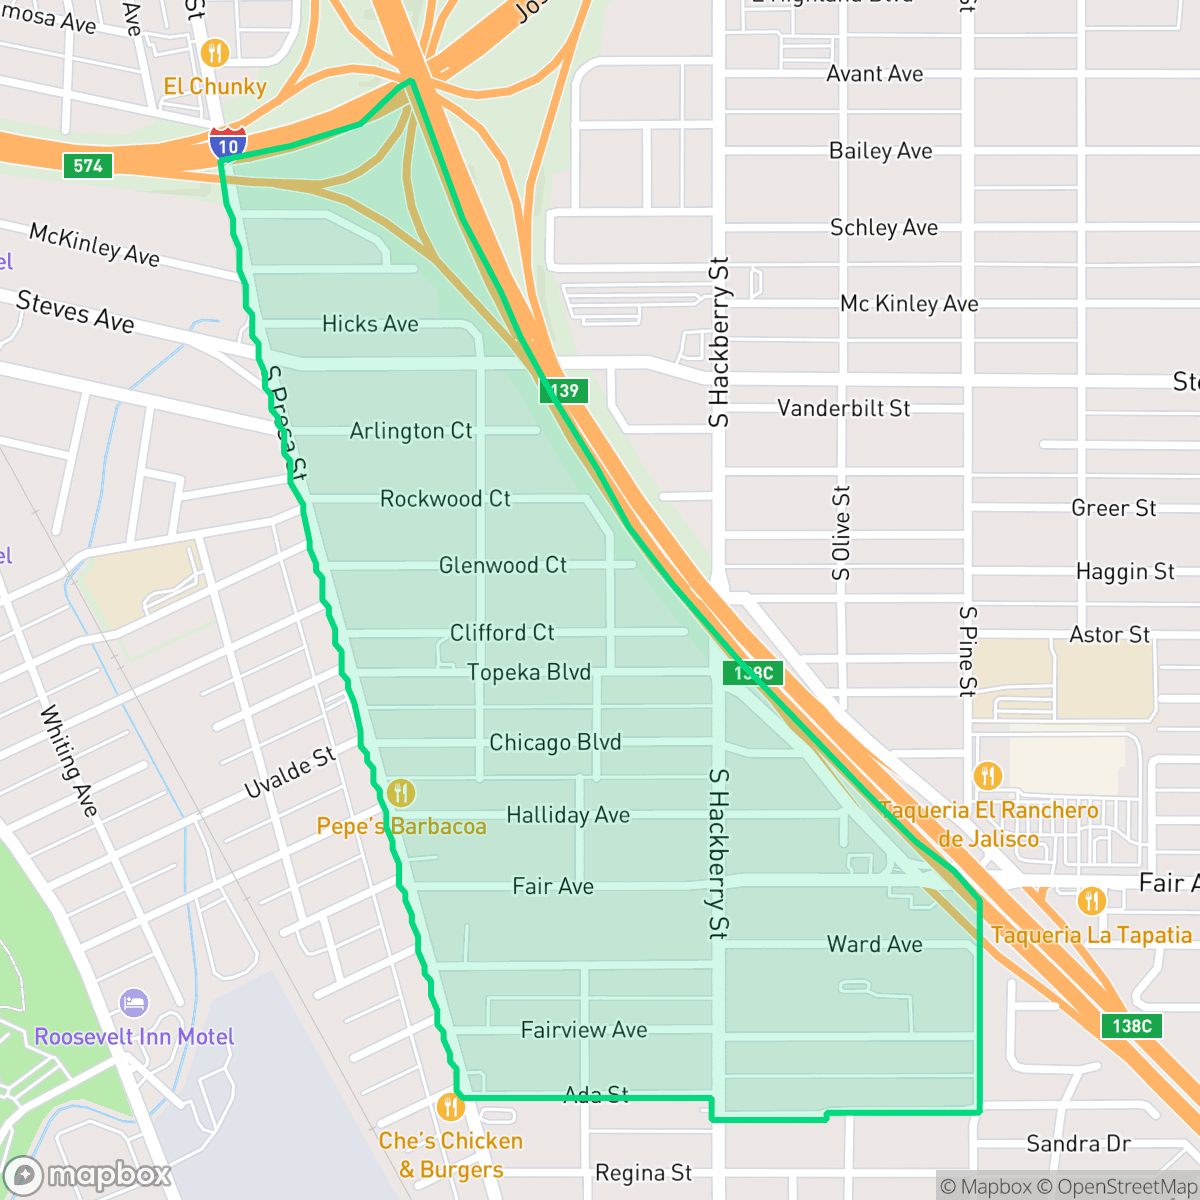
Riverside, San Antonio
Updated June 22, 2026 · 2,723 residents
Riverside is a quiet, suburban community in San Antonio defined by a mix of modest residential homes and industrial logistics hubs. While the area features a diverse age demographic, residents often experience significant noise from nearby freeways and limited access to public green spaces.
Key Highlights
About Riverside
The neighborhood serves as a functional, suburban landscape where residential pockets exist alongside active warehouses and major transportation corridors. With a population of approximately 2,723, the area maintains a distinctively liberal political identity and a balanced age distribution that includes young adults, families, and older residents. The architectural character is primarily modest, consisting of simple homes on narrow lots that prioritize utility over luxury amenities or extensive landscaping.
Prospective residents should consider the practical trade-offs of living in this sector. According to iHuus data, the area faces challenges with frequent traffic noise from adjacent freeways and railroad tracks, as well as limited pedestrian infrastructure that complicates walking. The neighborhood is situated within a designated floodplain, which makes property insurance a key consideration, and air quality levels remain a concern for sensitive groups. While the area provides a quiet and accessible environment, it is best suited for those who prioritize proximity to transit routes and a functional, low-key lifestyle over extensive community amenities.
Neighborhood Scores Across 15 Qualities
Residential spacing varies between tightly clustered homes and standard suburban lots with private yards. This level of separation is slightly lower than the San Antonio average, according to iHuus data.
A major highway and inconsistent sidewalk coverage create significant barriers for pedestrians. While the grid layout offers connectivity, walking is less convenient here than in most other San Antonio neighborhoods.
Residential views consist of small, simple homes on narrow lots with minimal landscaping or luxury amenities. According to iHuus data, the visual variety and greenery in this area are below the San Antonio average.
Public park access and wide grassy verges are scarce in this area. According to iHuus data, most greenery is confined to private, fenced backyards rather than accessible community spaces, making this neighborhood less dog friendly than the San Antonio average.
Residential grids and industrial warehouses mingle with scattered green spaces. This landscape is slightly less open than the San Antonio average, offering a more developed suburban feel.
Primarily a quiet, suburban and industrial area, this neighborhood offers fewer social hubs and less pedestrian activity than the San Antonio average. Residents will find a mix of green space and local eateries, but the landscape is largely shaped by highway proximity and car-oriented convenience.
Frequent traffic and transit noise from nearby freeways and railroad tracks characterize this area. According to iHuus data, acoustic comfort is significantly lower than the San Antonio average.
Frequent unhealthy air quality levels pose a significant risk to sensitive groups. According to iHuus data, the air quality in Riverside is slightly worse than the San Antonio average.
Large warehouses and proximity to major highways contribute to higher levels of noise and localized pollution compared to the San Antonio average. Residential pockets exist alongside active logistics hubs and significant truck traffic.
Health insurance accessibility in Riverside is roughly in line with the San Antonio average. According to iHuus data, a significant portion of the local population lacks coverage.
Voting patterns and census indicators show a distinctly liberal political leaning that is significantly more pronounced than the San Antonio average.
Residents live alongside a balanced mix of young adults, families, and older populations. According to iHuus data, this age distribution is slightly more varied than the city average.
Frequent flood occurrences and placement within a designated floodplain make this area significantly more vulnerable to water damage than the San Antonio average. According to iHuus data, residents should expect a high likelihood of needing flood insurance for their properties.
Block-Level Insights for Riverside

iHuus Neighborhood Intelligence Insights
Get block-level neighborhood insights for Riverside
- Street-level scores — see how individual blocks compare, not just neighborhood averages
- Micro-zone boundaries — identify quiet pockets, flood boundaries, and walkable clusters before you visit
- 15 dimensions in full — walkability, noise, air quality, school quality, insurance coverage, population age profile, urban/rural index, and more
- Boundary risk alerts — know if your address sits near a block boundary where scores drop, the kind of detail no listing will ever mention
- School insights — individual school ratings and insights, not just district-level data
- Compare before you commit — side-by-side data across neighborhoods, down to block precision
No credit card required
Compare with Any Neighborhood
| Dimension | Riverside | 145 Association |
|---|---|---|
| 🚶 Walkabilityavg 6.44 | ||
| 🔊 Acoustic Comfortavg 4.07 | ||
| 🤫 Privacy Indexavg 5.75 | ||
| 🎨 Visual Appealavg 6.11 | ||
| 🐕 Dog Friendlinessavg 5.91 | ||
| 🗺️ Urban-Rural Indexavg 6.87 | ||
| ✨ Neighborhood Vibeavg 4.35 | ||
| 🏥 Health Insurance Coverageavg 5.94 | ||
| 🌿 Air Qualityavg 2.27 | ||
| 🏭 Industrial Proximityavg 8.31 | ||
| 🌊 Flood Safetyavg 4.2 | ||
| 🗳️ Ideological Leanavg 7.37 | ||
| 👥 Population Age Profileavg 4.68 | ||
| 🔥 Fire Safety | ||
| 🏫 School Quality |
Riverside Rankings
School Districts Serving Riverside
San Antonio ISD is currently a distressed district undergoing a high-stakes 'rightsizing' transformation to combat declining enrollment and a legacy of underfunded, aging facilities. While the district maintains prestigious, top-tier magnets like the Young Women's Leadership Academy, the broader portfolio is plagued by academic inconsistency, with nearly 40% of its schools rated 4/10 or lower. Despite a recent upgrade to a state 'C' rating and significant bond investment in infrastructure, the combination of a TEA corrective action plan for graduation rates, widespread literacy gaps, and the closure of 15 campuses reflects a system in a state of survival rather than stability.
Schools
School Insights for Riverside
Below average outcomes; significant attendance and academic challenges.
School Insights
See what's really behind every school rating near Riverside
- Individual school ratings — each school's own score with outcome context, not just a district average
- Enrollment & class size data — student-to-teacher ratio and how it compares to the state average
- Full demographics breakdown — ethnicity and gender composition for every school in the enrollment zone
- Every school in the district — all schools within the enrollment boundary ranked by rating, not just the closest one
- Grade levels & benchmarks — elementary through high school, with below/above state-average flags
No credit card required