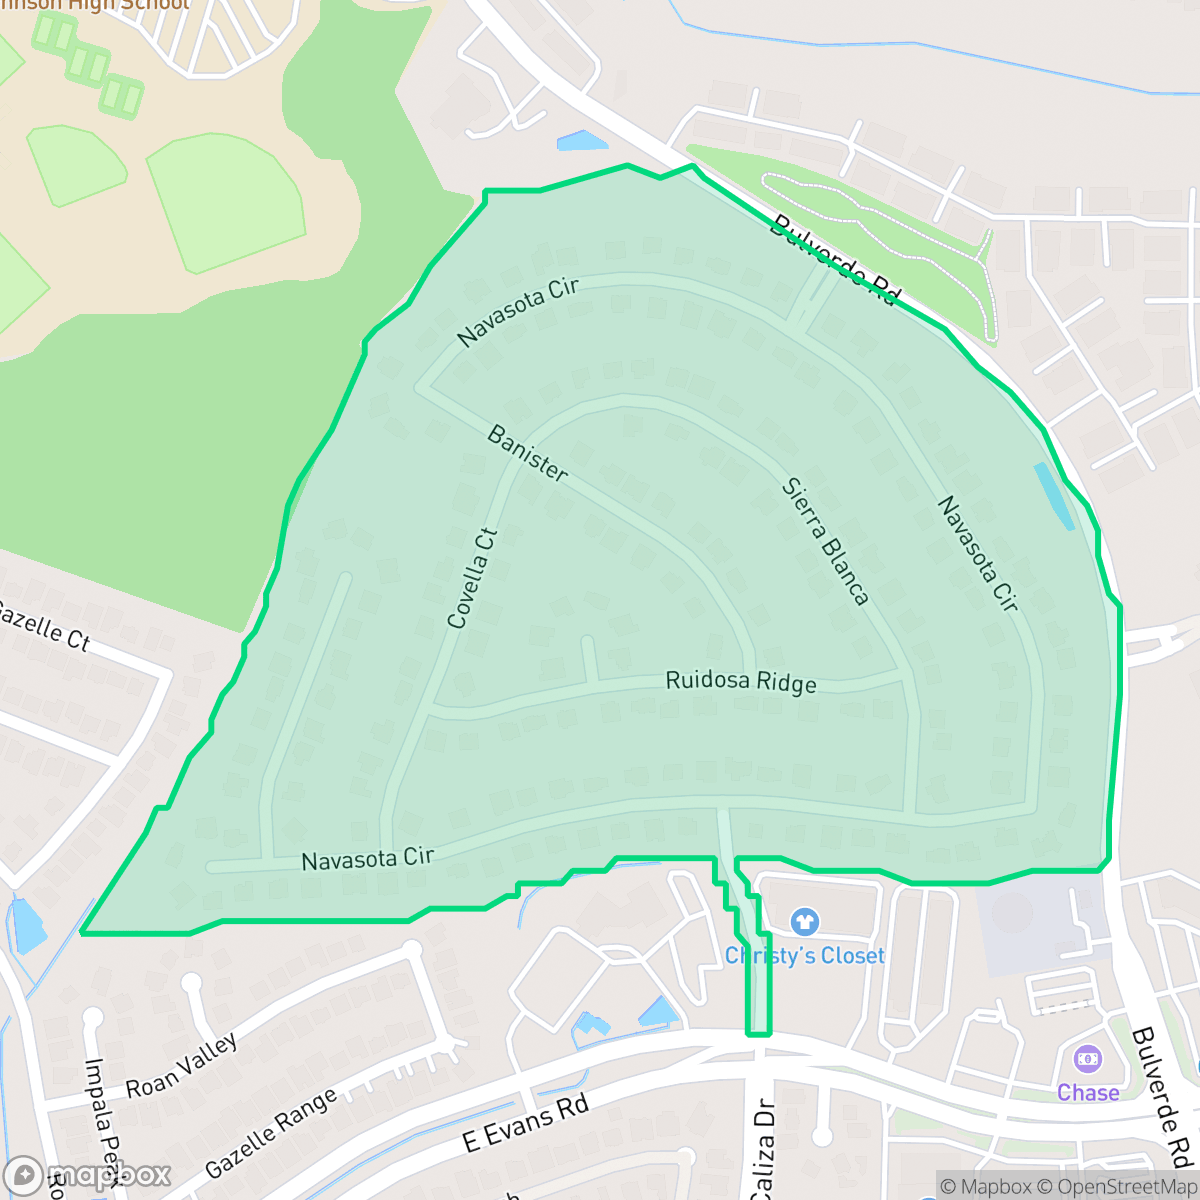
Encino Ranch, San Antonio
Updated June 22, 2026 · 639 residents
Encino Ranch is a suburban San Antonio community characterized by high visual appeal and robust flood safety. The area features a mix of residential streets and localized commercial hubs, offering residents convenient access to dining options while maintaining a quiet, suburban atmosphere.
Key Highlights
About Encino Ranch
Encino Ranch is situated in a suburban corridor of San Antonio, defined by its aesthetic appeal and well-maintained green spaces. The neighborhood balances residential living with nearby commercial activity, where residents can find diverse dining options such as 46th Street Pizzeria and Panfila Cantina. The area is served by the North East Independent School District, which is recognized for its strong academic performance and college readiness programs. Living in this neighborhood involves certain trade-offs, particularly regarding air quality and noise levels influenced by local road traffic. While the area offers high flood safety and excellent health insurance coverage, it is less suited for those seeking a highly walkable environment or extensive pet-friendly amenities. The community is best suited for individuals or families who prioritize aesthetic quality and proximity to essential services over urban density.
Neighborhood Scores Across 15 Qualities
Large lot sizes and significant separation between homes provide more privacy than is typically found in the San Antonio average. According to iHuus data, the residential spacing in Encino Ranch offers a more secluded living environment.
Sidewalks are available on one side of many streets and safe crossings are provided. This level of accessibility is higher than the San Antonio average according to iHuus data.
Expansive residences and high-end amenities define the local landscape, offering a significantly more manicured aesthetic than the San Antonio average according to iHuus data.
Access to local parks and wide green verges makes this area slightly more dog friendly than the San Antonio average, according to iHuus data.
Expansive open land and scattered homes characterize this area, offering a more rural atmosphere than the San Antonio average according to iHuus data.
Local dining and wellness businesses provide a noticeable level of activity compared to the San Antonio average. While certain pockets offer concentrated social hubs, the area remains largely car-dependent due to its low-density layout.
Frequent noise from nearby transit corridors is a common occurrence here. According to iHuus data, acoustic levels in this area are higher than the San Antonio average.
Frequent unhealthy air quality levels pose a significant risk to sensitive groups. According to iHuus data, air quality in this area is slightly worse than the San Antonio average.
Residential life is primarily uninterrupted by heavy industry, as the area consists of quiet streets and open green spaces with only occasional light commercial activity. According to iHuus data, this lack of industrial proximity is consistent with the San Antonio average.
Health insurance enrollment is significantly higher than the San Antonio average. Residents in this area benefit from a much greater proportion of covered individuals according to iHuus data.
Political leanings in this area are notably more conservative than the San Antonio average, featuring a conservative majority with some opposing presence.
Residents experience a diverse demographic spread of young adults, families, and seniors. This age distribution is roughly in line with the broader San Antonio area according to iHuus data.
Flood risk in this area is significantly lower than the San Antonio average, though some residual risk remains due to its location within a 500-year floodplain. According to iHuus data, the neighborhood is situated in a zone that is generally considered much safer from frequent flooding than most parts of the city.
Block-Level Insights for Encino Ranch

iHuus Neighborhood Intelligence Insights
Get block-level neighborhood insights for Encino Ranch
- Street-level scores — see how individual blocks compare, not just neighborhood averages
- Micro-zone boundaries — identify quiet pockets, flood boundaries, and walkable clusters before you visit
- 15 dimensions in full — walkability, noise, air quality, school quality, insurance coverage, population age profile, urban/rural index, and more
- Boundary risk alerts — know if your address sits near a block boundary where scores drop, the kind of detail no listing will ever mention
- School insights — individual school ratings and insights, not just district-level data
- Compare before you commit — side-by-side data across neighborhoods, down to block precision
No credit card required
Compare with Any Neighborhood
| Dimension | Encino Ranch | 145 Association |
|---|---|---|
| 🚶 Walkabilityavg 6.44 | ||
| 🔊 Acoustic Comfortavg 4.07 | ||
| 🤫 Privacy Indexavg 5.75 | ||
| 🎨 Visual Appealavg 6.11 | ||
| 🐕 Dog Friendlinessavg 5.91 | ||
| 🗺️ Urban-Rural Indexavg 6.87 | ||
| ✨ Neighborhood Vibeavg 4.35 | ||
| 🏥 Health Insurance Coverageavg 5.94 | ||
| 🌿 Air Qualityavg 2.27 | ||
| 🏭 Industrial Proximityavg 8.31 | ||
| 🌊 Flood Safetyavg 4.2 | ||
| 🗳️ Ideological Leanavg 7.37 | ||
| 👥 Population Age Profileavg 4.68 | ||
| 🔥 Fire Safety | ||
| 🏫 School Quality |
Encino Ranch Rankings
School Districts Serving Encino Ranch
NEISD is a high-performing, stable 'Blue Chip' district that currently maintains an overall 'A' grade and excellent college readiness metrics despite significant financial pressures. While it boasts elite flagship high schools and nationally recognized fine arts and STEM programs, the district is navigating a multi-million dollar budget deficit and a growing resource divide between its affluent northern corridors and older central campuses. Community trust remains generally high, supported by proactive security measures and a commitment to teacher retention, though ongoing debates over board governance and fiscal 'right-sizing' signal a period of transition that requires careful monitoring.
Schools
School Insights for Encino Ranch
Below average outcomes; significant attendance and academic challenges.
School Insights
See what's really behind every school rating near Encino Ranch
- Individual school ratings — each school's own score with outcome context, not just a district average
- Enrollment & class size data — student-to-teacher ratio and how it compares to the state average
- Full demographics breakdown — ethnicity and gender composition for every school in the enrollment zone
- Every school in the district — all schools within the enrollment boundary ranked by rating, not just the closest one
- Grade levels & benchmarks — elementary through high school, with below/above state-average flags
No credit card required