Community Workers Council, San Antonio
Updated June 22, 2026 · 6,041 residents
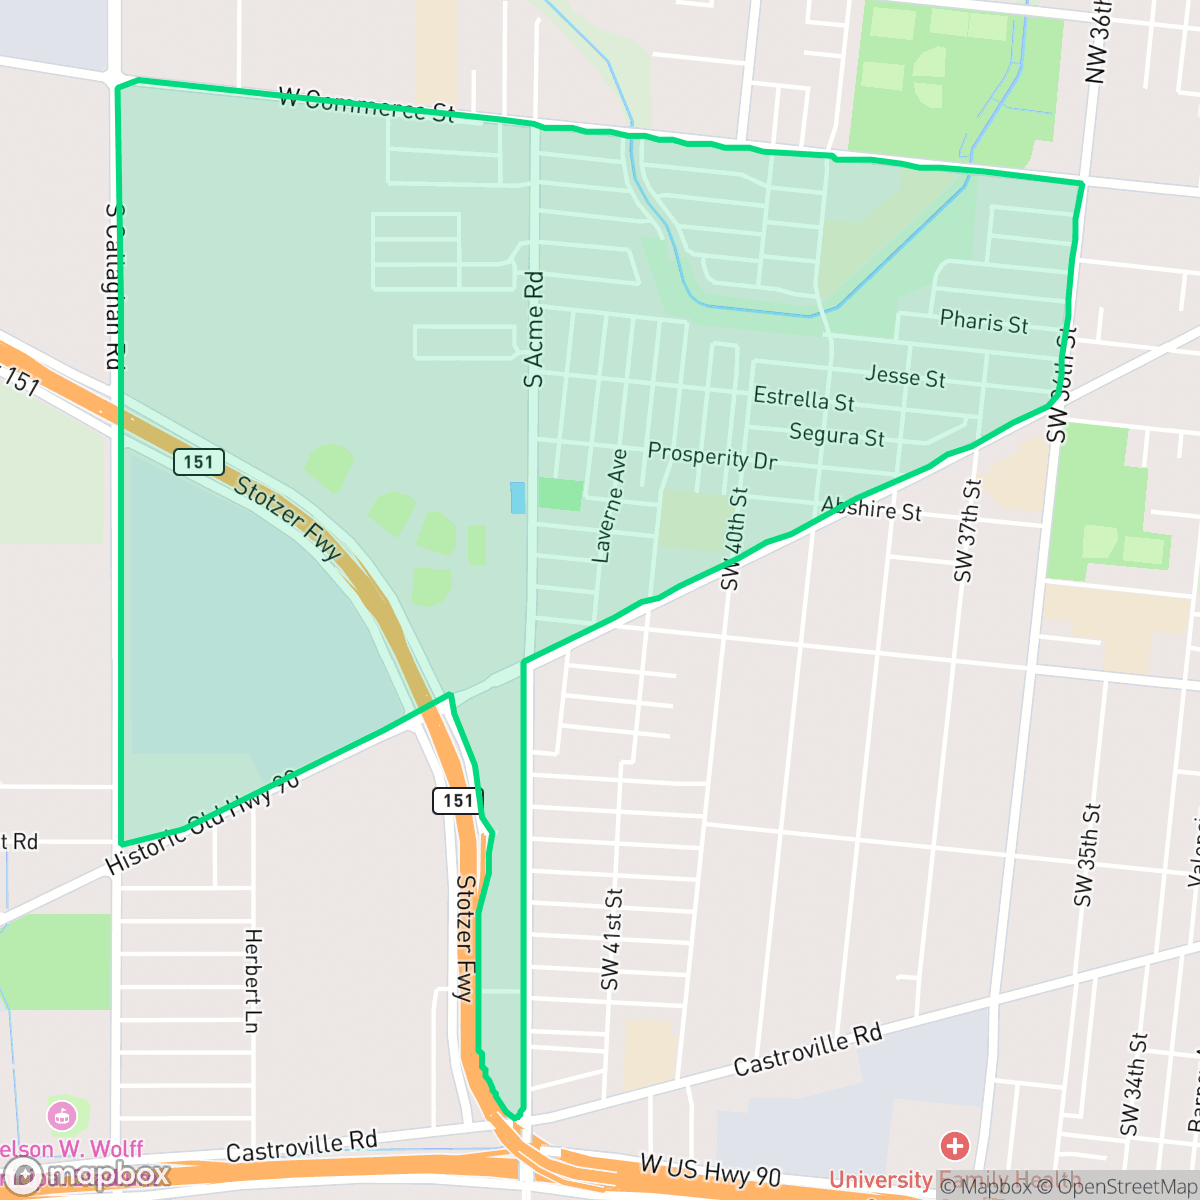
Community Workers Council is a dense suburban area in San Antonio defined by a mix of residential pockets and light industrial logistics hubs. While the neighborhood offers better-than-average walkability for the region, residents experience limited privacy due to tightly packed housing and significant truck traffic from nearby warehouses.
Key Highlights
About Community Workers Council
The Community Workers Council neighborhood features a distinct blend of single-family homes, multi-story apartments, and large-scale industrial warehouses. The landscape is characterized by quiet residential streets interspersed with active commercial zones, where local dining spots like Pila's Molino and El Tio Taquitos provide community hubs. According to iHuus data, the area maintains a moderate acoustic environment despite its proximity to major freight corridors and industrial facilities.
Prospective residents should note that the area faces challenges regarding air quality and flood safety, which are important considerations for long-term planning. While the Edgewood Independent School District serves the area with varying academic outcomes, the presence of institutions like Idea Monterrey Park College Preparatory offers high-performing educational options. The neighborhood is best suited for those who prioritize proximity to major transit routes and a suburban lifestyle over high-end architectural aesthetics or expansive private outdoor spaces.
Neighborhood Scores Across 15 Qualities
Residential spacing is slightly above the San Antonio average, providing a modest buffer between homes. Most properties feature small yards and shared fence lines, which offers limited separation from neighbors according to iHuus data.
Pedestrian infrastructure is inconsistent across the area, as sidewalks are often present on only one side of the street. While residential streets are low traffic and generally safe, arterial roads lack dedicated paths, making the walkability level slightly below the San Antonio average.
Modest tract homes with small yards and simple rooflines characterize this area. Visual variety and landscape amenities are below the San Antonio average, according to iHuus data.
A large central greenbelt with natural trails provides excellent off-street exercise space for pets. While residential blocks lack wide sidewalk verges, the neighborhood remains on par with the city average for dog friendliness according to iHuus data.
A blend of open agricultural fields and dense industrial warehouses defines the landscape, sitting slightly more developed than the San Antonio average. Residential pockets vary from low-density housing to suburban areas with significant warehouse and infrastructure presence.
A steady rhythm of residential life and light industrial activity defines the area, which mirrors the city average for liveliness. While some pockets offer local dining and green spaces, much of the landscape is characterized by quiet, car-dependent suburban blocks and warehouses.
Steady traffic sounds from nearby busy streets characterize the area, though the level of acoustic disturbance remains higher than the San Antonio average.
Frequent unhealthy air quality levels pose a significant risk to sensitive groups. This area is slightly worse than the San Antonio average, according to iHuus data.
Low levels of heavy industry and large-scale logistics hubs define this area, making it notably quieter regarding industrial traffic than the San Antonio average. Residents can expect a primarily residential environment with only occasional light commercial activity nearby.
Health insurance enrollment in this area is below the San Antonio average. According to iHuus data, a significant portion of the local population lacks coverage.
Voting patterns and census indicators show a notably progressive political leaning that is significantly more liberal than the San Antonio average.
Residents live among a balanced mix of young adults, families, and seniors. This demographic spread is slightly lower than the San Antonio average, according to iHuus data.
Significant flood risk exists here because the area is located within a designated 100-year floodplain. According to iHuus data, this level of risk is much higher than the San Antonio average and typically necessitates flood insurance.
Block-Level Insights for Community Workers Council

iHuus Neighborhood Intelligence Insights
Get block-level neighborhood insights for Community Workers Council
- Street-level scores — see how individual blocks compare, not just neighborhood averages
- Micro-zone boundaries — identify quiet pockets, flood boundaries, and walkable clusters before you visit
- 15 dimensions in full — walkability, noise, air quality, school quality, insurance coverage, population age profile, urban/rural index, and more
- Boundary risk alerts — know if your address sits near a block boundary where scores drop, the kind of detail no listing will ever mention
- School insights — individual school ratings and insights, not just district-level data
- Compare before you commit — side-by-side data across neighborhoods, down to block precision
No credit card required
Compare with Any Neighborhood
| Dimension | Community Workers Council | 145 Association |
|---|---|---|
| 🚶 Walkabilityavg 6.44 | ||
| 🔊 Acoustic Comfortavg 4.07 | ||
| 🤫 Privacy Indexavg 5.75 | ||
| 🎨 Visual Appealavg 6.11 | ||
| 🐕 Dog Friendlinessavg 5.91 | ||
| 🗺️ Urban-Rural Indexavg 6.87 | ||
| ✨ Neighborhood Vibeavg 4.35 | ||
| 🏥 Health Insurance Coverageavg 5.94 | ||
| 🌿 Air Qualityavg 2.27 | ||
| 🏭 Industrial Proximityavg 8.31 | ||
| 🌊 Flood Safetyavg 4.2 | ||
| 🗳️ Ideological Leanavg 7.37 | ||
| 👥 Population Age Profileavg 4.68 | ||
| 🔥 Fire Safety | ||
| 🏫 School Quality |
Community Workers Council Rankings
School Districts Serving Community Workers Council
Edgewood Independent School District is a distressed organization currently undergoing a painful 'right-sizing' transition due to a 15% enrollment drop and persistent budget deficits. While specialized 'Innovation Schools' and robust CTE programs provide pockets of excellence and community pride, the broader portfolio suffers from extreme academic inconsistency, with multiple campuses performing at the lowest state percentiles. Despite investments in security and mission-driven faculty, the district faces significant operational risks including potential campus closures and leadership instability that overshadow its localized academic successes.
Schools
School Insights for Community Workers Council
Below average outcomes; significant attendance and academic challenges.
School Insights
See what's really behind every school rating near Community Workers Council
- Individual school ratings — each school's own score with outcome context, not just a district average
- Enrollment & class size data — student-to-teacher ratio and how it compares to the state average
- Full demographics breakdown — ethnicity and gender composition for every school in the enrollment zone
- Every school in the district — all schools within the enrollment boundary ranked by rating, not just the closest one
- Grade levels & benchmarks — elementary through high school, with below/above state-average flags
No credit card required