Canyon View, San Antonio
Updated June 22, 2026 · 172 residents
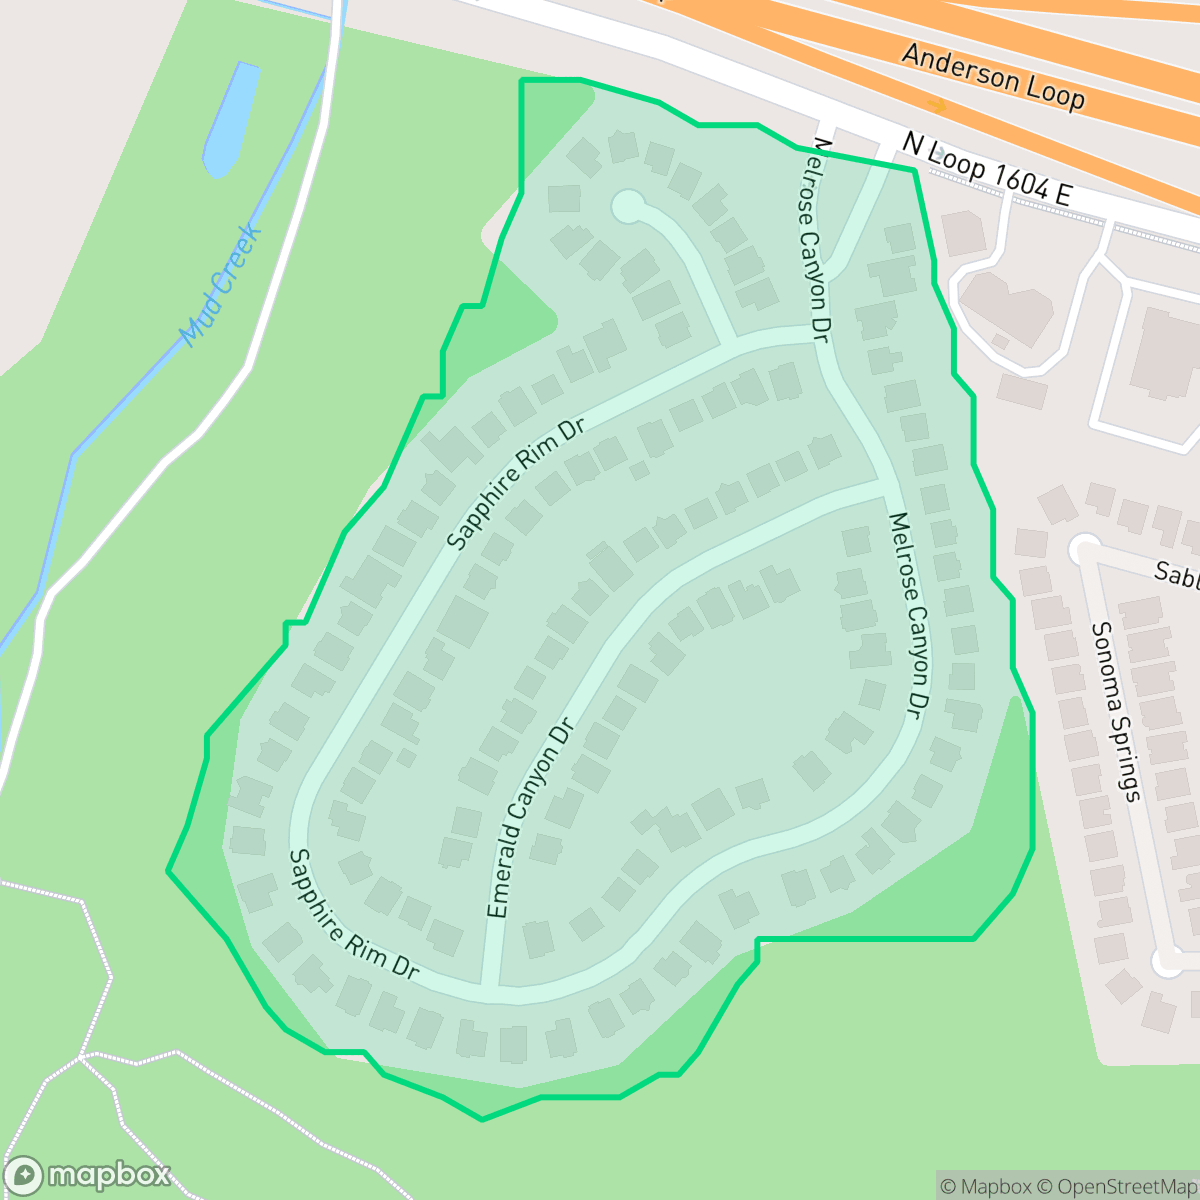
Canyon View is a quiet, rural-feeling enclave in San Antonio known for its high visual appeal and exceptional dog-friendliness. Residents benefit from high health insurance coverage and proximity to local dining, though the area experiences significant road noise from nearby highway traffic.
Key Highlights
About Canyon View
Canyon View is a low-density residential area that maintains a distinct rural atmosphere despite its location near major San Antonio thoroughfares. The neighborhood is characterized by its high visual appeal and open green spaces, making it an ideal environment for pet owners who prioritize outdoor access. Local staples such as the Redland Icehouse and El Chaparral provide convenient dining and social options within the immediate vicinity.
Potential residents should note that the area is notably loud due to consistent road traffic, which significantly impacts acoustic comfort. While the neighborhood offers a peaceful, low-density living experience with strong flood safety and high health insurance coverage, it is best suited for those who prioritize a rural aesthetic and pet-friendly surroundings over a quiet environment. Families are served by the North East Independent School District, which provides stable educational resources despite ongoing fiscal transitions.
Neighborhood Scores Across 15 Qualities
Residential spacing provides a consistent buffer between neighbors, offering slightly more seclusion than the San Antonio average. According to iHuus data, the area features a moderate density with varied distances between homes.
Low traffic volumes and calm streets provide a pleasant environment for pedestrians, though the lack of sidewalks makes it slightly less walkable than the San Antonio average.
Large homes and premium amenities create a highly manicured environment that is notably more visually appealing than the San Antonio average. According to iHuus data, the area features spacious driveways and well-maintained landscapes.
Extensive trail networks and large open parks provide significant space for pets. According to iHuus data, this access to outdoor recreation is much higher than the San Antonio average.
Large expanses of farmland and forested areas characterize this landscape, providing a much more rural environment than most of San Antonio. According to iHuus data, building density is minimal here.
Low-density development and scattered businesses create a subdued atmosphere that is notably less active than the San Antonio average. Most areas consist of quiet spaces near major highways with a focus on essential dining and localized services.
Persistent noise levels are significantly higher than the San Antonio average. Residents may experience frequent auditory disturbances according to iHuus data.
Frequent unhealthy air quality levels pose significant risks to sensitive groups. According to iHuus data, the air quality in Canyon View is slightly worse than the San Antonio average.
Industrial presence is nonexistent here, offering a landscape of quiet streets and open green spaces. According to iHuus data, this area lacks the warehouses or hazard sites found in many other parts of San Antonio.
Health insurance enrollment is exceptionally high in this area, significantly surpassing the San Antonio average. According to iHuus data, nearly all residents are covered, providing a high level of medical security for the community.
Political leanings in this area are balanced between conservative and liberal perspectives, representing a more moderate split than the more strongly partisan city average.
Residents live alongside a balanced mix of young adults, families, and seniors. According to iHuus data, this demographic spread is more varied than the typical age distribution found across San Antonio.
Flood safety in this area is significantly higher than the San Antonio average. While some residual risk exists due to proximity to the 500-year floodplain, the area is generally considered stable according to iHuus data.
Block-Level Insights for Canyon View

iHuus Neighborhood Intelligence Insights
Get block-level neighborhood insights for Canyon View
- Street-level scores — see how individual blocks compare, not just neighborhood averages
- Micro-zone boundaries — identify quiet pockets, flood boundaries, and walkable clusters before you visit
- 15 dimensions in full — walkability, noise, air quality, school quality, insurance coverage, population age profile, urban/rural index, and more
- Boundary risk alerts — know if your address sits near a block boundary where scores drop, the kind of detail no listing will ever mention
- School insights — individual school ratings and insights, not just district-level data
- Compare before you commit — side-by-side data across neighborhoods, down to block precision
No credit card required
Compare with Any Neighborhood
| Dimension | Canyon View | 145 Association |
|---|---|---|
| 🚶 Walkabilityavg 6.44 | ||
| 🔊 Acoustic Comfortavg 4.07 | ||
| 🤫 Privacy Indexavg 5.75 | ||
| 🎨 Visual Appealavg 6.11 | ||
| 🐕 Dog Friendlinessavg 5.91 | ||
| 🗺️ Urban-Rural Indexavg 6.87 | ||
| ✨ Neighborhood Vibeavg 4.35 | ||
| 🏥 Health Insurance Coverageavg 5.94 | ||
| 🌿 Air Qualityavg 2.27 | ||
| 🏭 Industrial Proximityavg 8.31 | ||
| 🌊 Flood Safetyavg 4.2 | ||
| 🗳️ Ideological Leanavg 7.37 | ||
| 👥 Population Age Profileavg 4.68 | ||
| 🔥 Fire Safety | ||
| 🏫 School Quality |
Canyon View Rankings
School Districts Serving Canyon View
NEISD is a high-performing, stable 'Blue Chip' district that currently maintains an overall 'A' grade and excellent college readiness metrics despite significant financial pressures. While it boasts elite flagship high schools and nationally recognized fine arts and STEM programs, the district is navigating a multi-million dollar budget deficit and a growing resource divide between its affluent northern corridors and older central campuses. Community trust remains generally high, supported by proactive security measures and a commitment to teacher retention, though ongoing debates over board governance and fiscal 'right-sizing' signal a period of transition that requires careful monitoring.
Schools
School Insights for Canyon View
Below average outcomes; significant attendance and academic challenges.
School Insights
See what's really behind every school rating near Canyon View
- Individual school ratings — each school's own score with outcome context, not just a district average
- Enrollment & class size data — student-to-teacher ratio and how it compares to the state average
- Full demographics breakdown — ethnicity and gender composition for every school in the enrollment zone
- Every school in the district — all schools within the enrollment boundary ranked by rating, not just the closest one
- Grade levels & benchmarks — elementary through high school, with below/above state-average flags
No credit card required