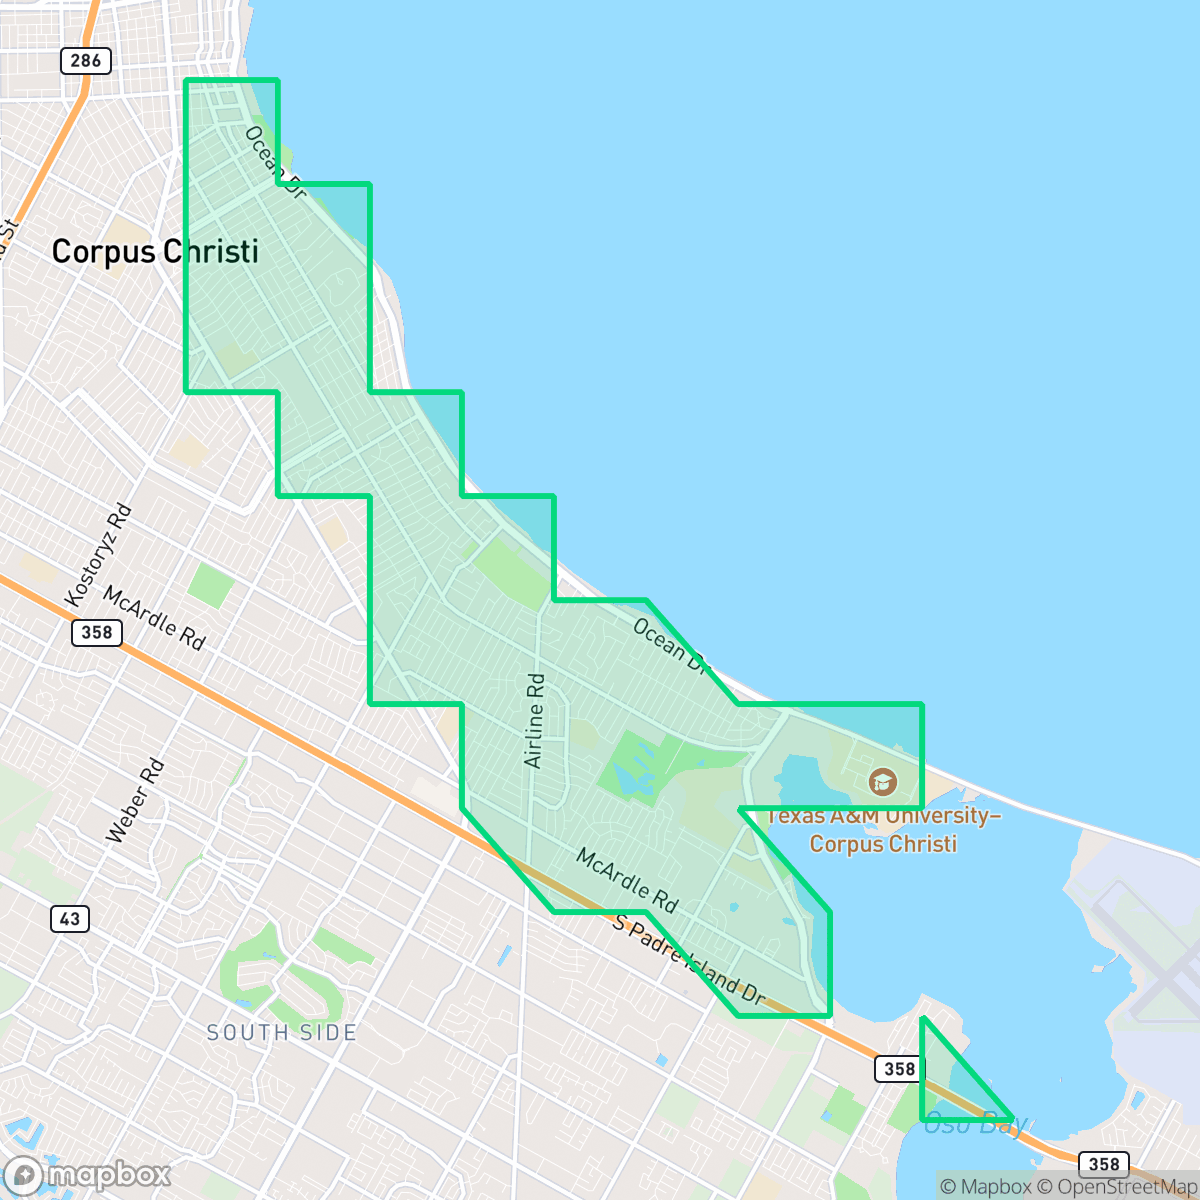
Bay Area, Corpus Christi
Updated June 22, 2026 · 40,104 residents
The Bay Area is a coastal neighborhood defined by its historic architecture and scenic proximity to the Gulf of Mexico. While the area features a structured grid with accessible sidewalks, residents primarily rely on vehicles for daily errands and commuting.
Key Highlights
About Bay Area
The Bay Area neighborhood in Corpus Christi, Texas, is a historic waterfront community anchored by the scenic Ocean Drive, which dates back to 1904. Developed primarily between the 1930s and 1960s, the neighborhood is characterized by a rich stock of midcentury ranch homes, coastal cottages, and grand architectural estates. Notable landmarks along Ocean Drive include Watsonia, a unique 1938 Pueblo-influenced estate, and the 1930 Mediterranean-style Crook Estate, which features a rare Lord & Burnham greenhouse and a 1750 New Orleans iron fence. The neighborhood’s signature public space, Cole Park, originated from a six-acre donation by real estate developer E.B. Cole in the 1920s and was expanded by 20 acres in the 1960s through land reclamation and seawall construction.
The neighborhood maintains a dense suburban character, balancing established residential blocks with light commercial hubs. Residents benefit from a reliable layout of sidewalks and green verges, which support a moderate level of outdoor activity despite the prevalence of car-dependent retail centers. The area offers a high degree of flood safety and a stable mix of housing types, ranging from midcentury ranch homes to modern multi-family complexes. According to iHuus data, the environment is generally quiet, though the proximity to major roadways contributes to a baseline of traffic noise. Prospective residents should note that while the neighborhood provides essential services and local dining, most daily trips require a vehicle. The area is well-suited for those who value coastal access and established school options, including those in the Flour Bluff and Corpus Christi independent school districts. While the community is largely residential and free from heavy industrial hazards, the presence of specific infrastructure like local wastewater facilities is a factor in the broader landscape. Overall, it serves as a steady, quiet environment for those prioritizing a balance of coastal lifestyle and suburban convenience.
Neighborhood Scores Across 15 Qualities
Residential spacing is consistent with the city average, offering a mix of shared apartment walls and standard suburban lot distances. Some areas feature dense clusters with closely spaced houses, while other sections provide more buffer between neighbors.
Pedestrian access is better than the Corpus Christi average due to a consistent sidewalk network on many residential streets. While some high-traffic arterials and heavy tree canopy may obscure paths or complicate crossings, the area remains navigable for those on foot.
Larger homes and upscale amenities contribute to a visual landscape that is slightly more polished than the Corpus Christi average. While some areas feature standard mid-century tract housing, many properties offer spacious driveways and prominent residential features.
Wide green verges and accessible school athletic fields provide more public space for pet owners than the Corpus Christi average. According to iHuus data, several small neighborhood parks and continuous green corridors facilitate easy dog walking throughout the residential grid.
Residential layouts range from dense suburban developments to low-density areas featuring significant open green space. This landscape is slightly less developed than the Corpus Christi average, offering a blend of organized street networks and scattered open land.
A predictable rhythm of residential life and essential services defines this area, offering slightly more activity than the Corpus Christi average. While some pockets are quiet and coastal, many sections provide reliable access to diverse dining and local amenities.
Frequent disturbances from nearby transit corridors, such as busy freeways or rail lines, characterize the acoustic environment. According to iHuus data, these noise levels are slightly higher than the average for Corpus Christi.
Frequent unhealthy air quality levels pose significant risks to sensitive groups. According to iHuus data, the air quality in this area is worse than the Corpus Christi average.
Residential and light commercial uses dominate the landscape, with almost no heavy industrial hazards or large warehouses visible. While a wastewater treatment facility exists in the northeast corner, the area remains notably clearer of industrial activity than the Corpus Christi average, according to iHuus data.
Health insurance access is slightly above the Corpus Christi average. According to iHuus data, a portion of the population remains uninsured.
Political perspectives in this area are evenly distributed between conservative and liberal leanings, mirroring the broader political landscape of Corpus Christi.
Residents will find a balanced demographic spread consisting of young adults, families, and seniors. This age distribution is very similar to the overall average found across Corpus Christi.
Flood risk in this area is relatively low and stays above the Corpus Christi average, though some residual risk remains within the 500-year floodplain according to iHuus data.
Block-Level Insights for Bay Area

iHuus Neighborhood Intelligence Insights
Get block-level neighborhood insights for Bay Area
- Street-level scores — see how individual blocks compare, not just neighborhood averages
- Micro-zone boundaries — identify quiet pockets, flood boundaries, and walkable clusters before you visit
- 15 dimensions in full — walkability, noise, air quality, school quality, insurance coverage, population age profile, urban/rural index, and more
- Boundary risk alerts — know if your address sits near a block boundary where scores drop, the kind of detail no listing will ever mention
- School insights — individual school ratings and insights, not just district-level data
- Compare before you commit — side-by-side data across neighborhoods, down to block precision
No credit card required
Compare with Any Neighborhood
| Dimension | Bay Area | Calallen |
|---|---|---|
| 🚶 Walkabilityavg 6.64 | ||
| 🔊 Acoustic Comfortavg 3.2 | ||
| 🤫 Privacy Indexavg 5.84 | ||
| 🎨 Visual Appealavg 5.86 | ||
| 🐕 Dog Friendlinessavg 5.86 | ||
| 🗺️ Urban-Rural Indexavg 6.92 | ||
| ✨ Neighborhood Vibeavg 4.45 | ||
| 🏥 Health Insurance Coverageavg 5.57 | ||
| 🌿 Air Qualityavg 4.09 | ||
| 🏭 Industrial Proximityavg 7.95 | ||
| 🌊 Flood Safetyavg 6.95 | ||
| 🗳️ Ideological Leanavg 4.8 | ||
| 👥 Population Age Profileavg 4.84 | ||
| 🔥 Fire Safety | ||
| 🏫 School Quality |
Bay Area Rankings
School Districts Serving Bay Area
Flour Bluff Independent School District is a stable, high-performing organization with strong community backing and an impressive extracurricular pedigree. It maintains solid academic standing, particularly in its upper-level feeder schools, and is currently undergoing a significant facilities modernization phase funded by a recent bond measure. While the district faces typical regional challenges such as a slight enrollment decline and moderate performance at the elementary level, its financial transparency, prestigious NJROTC program, and consistent athletic dominance solidify its status as a top-tier educational entity in the Corpus Christi area.
Schools
Corpus Christi ISD is a stable but transitioning district characterized by exceptional financial stewardship and a tier of high-performing specialty schools that contrast with lower-performing neighborhood campuses. While it holds a consistent 'Superior' financial rating and enjoys strong community partnerships, the district is currently navigating the difficult process of consolidating seven schools in response to declining enrollment. Proficiency levels in core subjects trail state averages, leading to new academic initiatives like the Cambridge Math program. Overall, the district remains a solid choice for specialty education, but it faces operational headwinds as it rightsizes its infrastructure and seeks to bridge the achievement gap across its 50+ campuses.
Schools
School Insights for Bay Area
Below average outcomes; significant attendance and academic challenges.
School Insights
See what's really behind every school rating near Bay Area
- Individual school ratings — each school's own score with outcome context, not just a district average
- Enrollment & class size data — student-to-teacher ratio and how it compares to the state average
- Full demographics breakdown — ethnicity and gender composition for every school in the enrollment zone
- Every school in the district — all schools within the enrollment boundary ranked by rating, not just the closest one
- Grade levels & benchmarks — elementary through high school, with below/above state-average flags
No credit card required