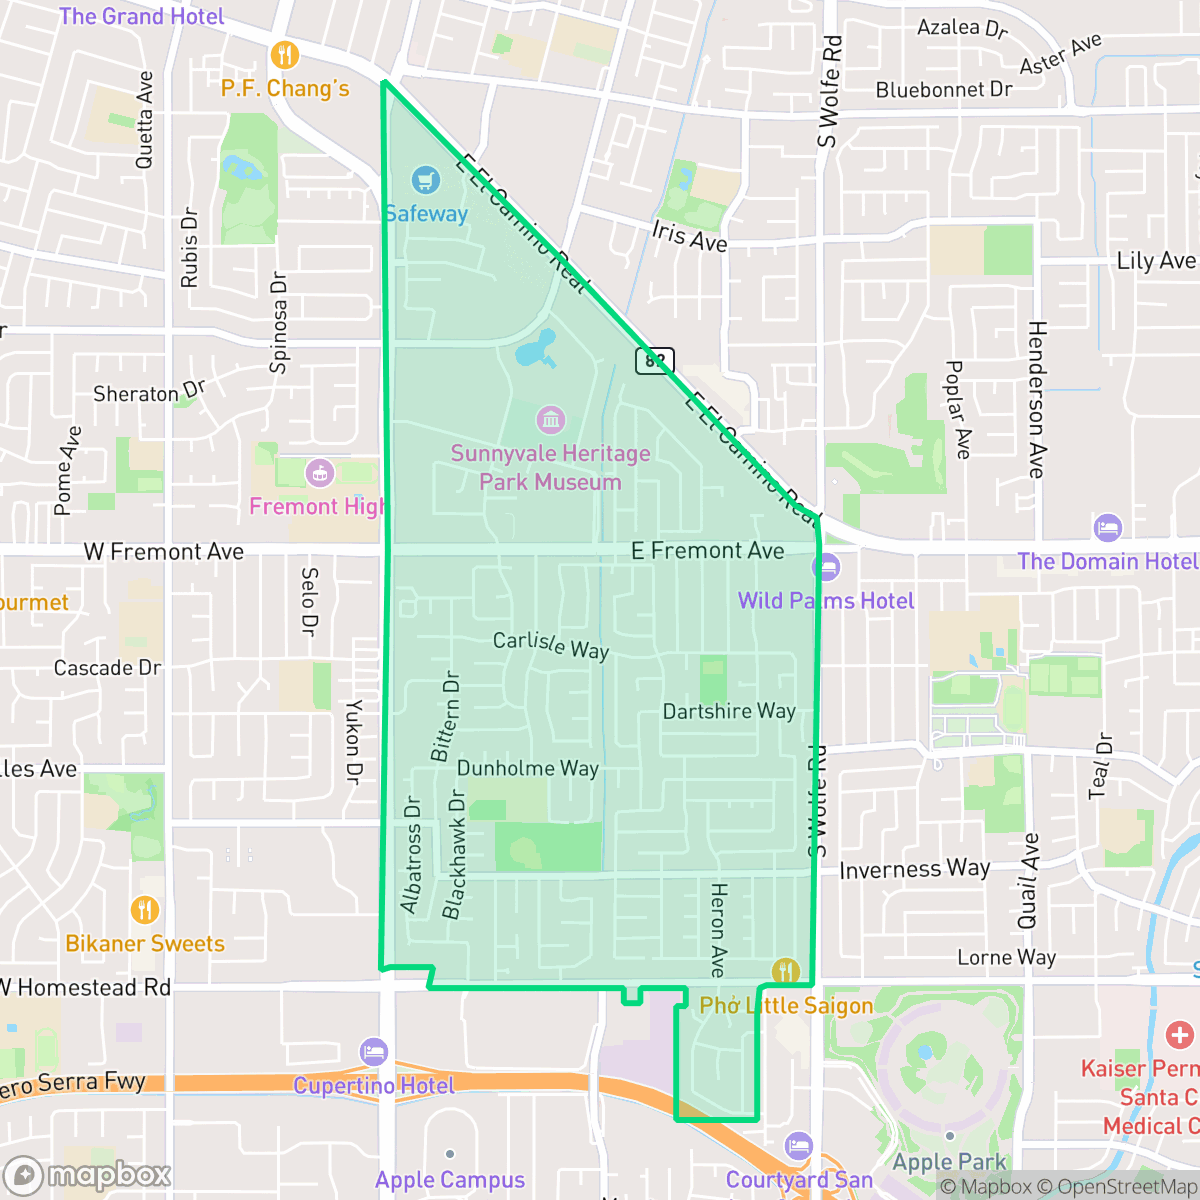
Ortega, Sunnyvale
Updated June 22, 2026 · 17,020 residents
Ortega is a highly walkable, dense suburban neighborhood in Sunnyvale characterized by its mid-century architecture and well-manicured residential streets. Residents benefit from excellent pedestrian infrastructure and proximity to local parks, though the area experiences notable noise levels from nearby road traffic.
Key Highlights
About Ortega
The Ortega neighborhood in Sunnyvale, California, transitioned from agricultural orchards and strawberry fields into a residential community during the post-World War II Silicon Valley tech boom of the 1950s and 1960s. The neighborhood's housing stock is characterized by mid-century ranch-style homes and iconic modernist Eichler designs. At the heart of the community is Ortega Park, an 18.16-acre public space established in 1974. The park is named after Francisco Ortega, a prominent 19th-century Mexican landowner in the region. Featuring a distinctive Victorian design theme and a central gazebo, the park serves as a major local landmark and a cultural hub, notably providing permanent facilities for the historic Sunnyvale Cricket Club.
The neighborhood features a dense suburban layout that blends single-family homes with apartment complexes and light commercial zones. The area is defined by its visual appeal, with many properties boasting private pools and well-maintained landscaping, creating an affluent atmosphere. With a perfect walkability score, the community offers continuous sidewalk networks on both sides of the streets, making it easy for residents to navigate the area on foot. While the environment is largely residential and free of industrial hazards, the presence of major roads contributes to a baseline noise level of approximately 62 decibels, which is a primary consideration for those sensitive to acoustic disturbances.
This community is well-suited for professionals and families who prioritize access to high-performing schools and recreational spaces. The neighborhood maintains a strong sense of stability, supported by high rates of health insurance coverage and a consistent ideological profile. While the housing density results in close proximity between neighbors, the abundance of green verges and accessible parkland provides ample space for outdoor activities and pet owners. Prospective residents should balance the benefits of the neighborhood's central location and educational opportunities against the typical trade-offs of living in a high-density Silicon Valley suburb.
Neighborhood Scores Across 15 Qualities
Housing layouts vary between shared-wall apartment complexes and detached single-family homes with small setbacks. This level of density is slightly higher than the average for Sunnyvale.
Pedestrian infrastructure is exceptionally robust, featuring continuous sidewalks on both sides of streets and well-defined crosswalks at major intersections. This network of sidewalks and pedestrian-priority paths is even more comprehensive than the Sunnyvale average.
Large, well-maintained homes with private pools and manicured landscaping define much of the area, offering a visual quality that is slightly above the Sunnyvale average. According to iHuus data, the presence of expansive driveways and lush greenery contributes to a polished suburban atmosphere.
Large central parks, school fields, and wide green verges along residential streets provide plenty of space for pets. This level of accessibility to greenery and walking paths is consistent with the city average.
Residential layouts feature a mix of single-family homes, multi-unit complexes, and commercial retail zones. This level of density is consistent with the broader Sunnyvale area.
Suburban streets and green spaces offer a diverse selection of dining and social hubs that are notably more active than the Sunnyvale average. Residents can access various local restaurants and wellness services, though the density of walkable amenities varies between different blocks in the area.
Frequent sounds from nearby railroad tracks and major freeways contribute to significant acoustic disturbance. According to iHuus data, the level of noise in this area is higher than the average found throughout Sunnyvale.
Air quality in this area fluctuates between acceptable and unhealthy levels, posing occasional concerns for sensitive groups. According to iHuus data, these conditions are consistent with the city average.
Industrial activity and warehouses are absent from this area, providing a landscape that is significantly cleaner of heavy industry than the Sunnyvale average. According to iHuus data, the neighborhood consists exclusively of residential, retail, and institutional uses with no detectable industrial hazards.
Health insurance access is nearly universal among residents in this area, which is notably higher than the Sunnyvale average according to iHuus data.
Voting patterns and census indicators show a predominantly liberal political leaning that is consistent with the rest of Sunnyvale.
Residents live alongside a balanced mix of young adults, families, and seniors. This demographic distribution is consistent with the average across Sunnyvale, according to iHuus data.
Properties in this area are located within a designated floodplain, which may necessitate flood insurance. According to iHuus data, the flood risk in Ortega is notably higher than the Sunnyvale city average.
Block-Level Insights for Ortega

iHuus Neighborhood Intelligence Insights
Get block-level neighborhood insights for Ortega
- Street-level scores — see how individual blocks compare, not just neighborhood averages
- Micro-zone boundaries — identify quiet pockets, flood boundaries, and walkable clusters before you visit
- 15 dimensions in full — walkability, noise, air quality, school quality, insurance coverage, population age profile, urban/rural index, and more
- Boundary risk alerts — know if your address sits near a block boundary where scores drop, the kind of detail no listing will ever mention
- School insights — individual school ratings and insights, not just district-level data
- Compare before you commit — side-by-side data across neighborhoods, down to block precision
No credit card required
Compare with Any Neighborhood
| Dimension | Ortega | Birdland |
|---|---|---|
| 🚶 Walkabilityavg 9.5 | ||
| 🔊 Acoustic Comfortavg 2.69 | ||
| 🤫 Privacy Indexavg 4.94 | ||
| 🎨 Visual Appealavg 6.66 | ||
| 🐕 Dog Friendlinessavg 6.76 | ||
| 🗺️ Urban-Rural Indexavg 6.55 | ||
| ✨ Neighborhood Vibeavg 4.49 | ||
| 🏥 Health Insurance Coverageavg 9.05 | ||
| 🌿 Air Qualityavg 6 | ||
| 🏭 Industrial Proximityavg 7.42 | ||
| 🌊 Flood Safetyavg 3.58 | ||
| 🗳️ Ideological Leanavg 9.69 | ||
| 👥 Population Age Profileavg 4.85 | ||
| 🔥 Fire Safety | ||
| 🏫 School Quality |
Ortega Rankings
School Districts Serving Ortega
Fremont Union High School District is a premier 'Blue Chip' organization characterized by exceptional academic results, state-of-the-art facilities, and high community confidence. While it navigates the regional challenges of high housing costs and a 2% annual enrollment decline, the district remains a top-tier destination with high schools that consistently rank in the national top 10%. Administrative stability is reflected in proactive wellness initiatives and successful facility upgrades at Fremont and Homestead. Despite the intense academic pressure reported by students, the district's 'A+' standing, robust extracurricular ecosystem, and fiscal resilience solidify its status as a leading educational entity.
Schools
CUSD remains an academic powerhouse with test scores in the top 1% of California, bolstered by a portfolio of exceptionally high-performing schools and a robust STEM curriculum. Despite its 'Blue Chip' academic standing, the district is currently categorized as 'Solid/Stable' (4) rather than a 5 due to significant fiscal volatility and declining enrollment. Operational health is strained by a multi-million dollar deficit and controversial cost-cutting measures, including staff layoffs and program closures like the CuperDoodle Preschool. While the district remains solvent and highly desirable for families, the ongoing friction between its 'basic aid' funding model and state mandates, coupled with a perceived lack of administrative transparency, indicates a period of transition and tightening constraints.
Schools
Sunnyvale Elementary School District is a high-performing, financially stable organization that effectively balances traditional academic excellence with forward-looking technology initiatives. While a performance gap exists between its elite 10/10 schools and lower-rated Title I campuses, the district's recent 'California Distinguished School' award for gap-closing efforts and its strategic debt refinancing demonstrate sophisticated operational management. With stable leadership, competitive teacher incentives, and strong community backing in a premier Silicon Valley location, the district remains a highly desirable 'Solid/Stable' entity with clear 'Blue Chip' trajectories in its top-tier neighborhood schools.
Schools
Santa Clara Unified School District is a high-performing academic entity currently navigating a period of significant fiscal instability. While the district boasts prestigious schools with ratings reaching 10/10 and showing year-over-year gains in state testing, it is grappling with a $30 million budget deficit and a projected enrollment decline. The unanimous board approval of over 100 staff layoffs in early 2026 highlights a necessary but painful 'rightsizing' phase. Despite these financial pressures, the district remains a destination for families due to its robust high school offerings and innovative teacher housing initiatives, though its long-term operational health depends on successfully stabilizing its budget and reserves.
Schools
School Insights for Ortega
Below average outcomes; significant attendance and academic challenges.
School Insights
See what's really behind every school rating near Ortega
- Individual school ratings — each school's own score with outcome context, not just a district average
- Enrollment & class size data — student-to-teacher ratio and how it compares to the state average
- Full demographics breakdown — ethnicity and gender composition for every school in the enrollment zone
- Every school in the district — all schools within the enrollment boundary ranked by rating, not just the closest one
- Grade levels & benchmarks — elementary through high school, with below/above state-average flags
No credit card required