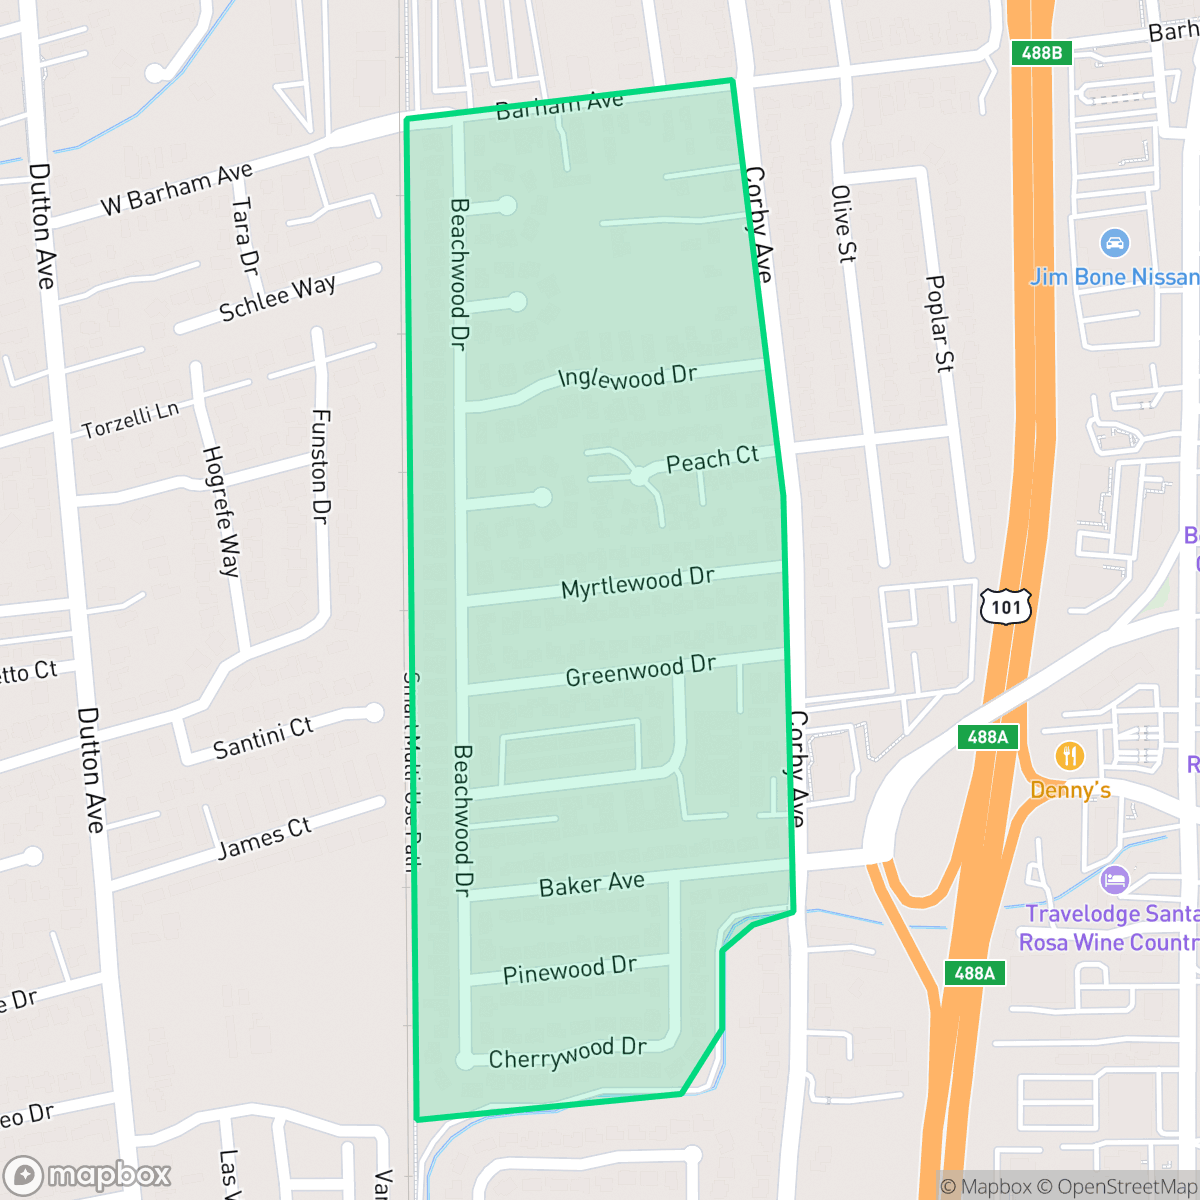
Corby/Beachwood, Santa Rosa
Updated June 22, 2026 · 1,084 residents
Corby/Beachwood is a compact, pedestrian-friendly neighborhood in Southwest Santa Rosa characterized by a mix of residential blocks and light industrial spaces. Residents benefit from a highly accessible street grid, though the area experiences notable noise from local traffic and nearby rail lines.
Key Highlights
About Corby/Beachwood
The neighborhood features a dense suburban layout with single-family homes situated on modest lots. Its location provides a steady, consistent character, supported by a comprehensive sidewalk network that makes the area highly walkable for daily errands. While it maintains a residential feel, the presence of small warehouses and industrial lots along its central axis contributes to a distinct, utilitarian atmosphere that defines the local landscape.
Living here involves specific trade-offs, particularly regarding environmental and safety factors. The area faces significant challenges with flood and fire risks, and noise levels are elevated due to proximity to road and rail traffic. It is best suited for individuals who prioritize walkability and proximity to local services over expansive private outdoor space, as the neighborhood offers a functional, community-centric environment rather than a secluded retreat.
Neighborhood Scores Across 15 Qualities
Residential spacing varies between homes with shared walls and properties featuring moderate buffers. According to iHuus data, privacy levels are roughly in line with the Santa Rosa average.
Safe pedestrian routes and a comprehensive sidewalk network are available throughout the residential and commercial blocks. This level of accessibility for walkers is consistent with the rest of Santa Rosa.
Standard tract housing and multi-unit complexes feature modest lots and uniform roof geometries. This residential area presents a more functional, less varied aesthetic than the Santa Rosa average, according to iHuus data.
Large open fields and consistent sidewalks with green verges provide adequate space for pets. However, access to dog-friendly amenities is below the Santa Rosa average.
Frequent open land and scattered homes among woodlands provide a more semi-rural atmosphere than the more urbanized parts of Santa Rosa. According to iHuus data, the area features a mix of dense suburban layouts and larger industrial structures alongside patches of natural landscape.
Residential life here is characterized by a steady, calm rhythm that is slightly more active than the Santa Rosa average. While local dining options are available, most commercial services require a short drive as few businesses are within immediate walking distance.
Frequent noise from nearby freeway and railroad traffic is common in this area. According to iHuus data, acoustic comfort is lower than the Santa Rosa average.
Air quality levels here are consistent with the Santa Rosa average, characterized by a blend of acceptable and unhealthy days that may occasionally affect sensitive groups according to iHuus data.
Light industrial buildings and warehouses are concentrated in the southeastern and central parts of the area, resulting in more commercial traffic than the Santa Rosa average. According to iHuus data, these zones may introduce occasional noise or activity related to daytime commercial operations.
Health insurance accessibility is strong in this area, with coverage rates notably higher than the Santa Rosa average according to iHuus data.
Voting patterns and census indicators show a very high concentration of liberal-leaning residents, which is slightly more pronounced than the Santa Rosa average according to iHuus data.
Residents live alongside a balanced demographic of young adults, families, and seniors. This age distribution is slightly lower than the Santa Rosa average, indicating a slightly less even spread across age groups.
Located in a coastal high-hazard zone subject to wave action, this area carries a significantly higher risk of flooding than the Santa Rosa average. Residents should prepare for elevated or potentially prohibitive flood insurance costs according to iHuus data.
Block-Level Insights for Corby/Beachwood

iHuus Neighborhood Intelligence Insights
Get block-level neighborhood insights for Corby/Beachwood
- Street-level scores — see how individual blocks compare, not just neighborhood averages
- Micro-zone boundaries — identify quiet pockets, flood boundaries, and walkable clusters before you visit
- 15 dimensions in full — walkability, noise, air quality, school quality, insurance coverage, population age profile, urban/rural index, and more
- Boundary risk alerts — know if your address sits near a block boundary where scores drop, the kind of detail no listing will ever mention
- School insights — individual school ratings and insights, not just district-level data
- Compare before you commit — side-by-side data across neighborhoods, down to block precision
No credit card required
Compare with Any Neighborhood
| Dimension | Corby/Beachwood | Aston Ave |
|---|---|---|
| 🚶 Walkabilityavg 8.16 | ||
| 🔊 Acoustic Comfortavg 4.3 | ||
| 🤫 Privacy Indexavg 5.6 | ||
| 🎨 Visual Appealavg 6.73 | ||
| 🐕 Dog Friendlinessavg 7.28 | ||
| 🗺️ Urban-Rural Indexavg 7.07 | ||
| ✨ Neighborhood Vibeavg 4.43 | ||
| 🏥 Health Insurance Coverageavg 7.43 | ||
| 🌿 Air Qualityavg 6 | ||
| 🏭 Industrial Proximityavg 8.62 | ||
| 🌊 Flood Safetyavg 3.62 | ||
| 🗳️ Ideological Leanavg 9.57 | ||
| 👥 Population Age Profileavg 5.13 | ||
| 🔥 Fire Safety | ||
| 🏫 School Quality |
Corby/Beachwood Rankings
School Districts Serving Corby/Beachwood
Bellevue Union School District functions as a stable, community-centric elementary district that prioritizes social-emotional support and facility modernization over high-stakes academic performance. While ground truth data reveals concerningly low proficiency ratings across all four campuses (ranging from 2/10 to 4/10), the district maintains strong operational health through successful bond measures, proactive 'Community School' grant integration, and stable leadership. It is currently in a transitional state: grappling with declining enrollment and regional staffing costs while simultaneously earning high marks for its inclusive culture and facility upgrades. For families, it offers a supportive, 'whole-child' environment, though it lacks the competitive academic metrics of neighboring affluent districts.
Schools
Santa Rosa High School District is currently in a distressed state, struggling with a $15 million budget deficit and declining enrollment that has triggered layoff notices and community distrust. While the district maintains some high-performing assets like Maria Carrillo High and successful CTE expansions, the overall portfolio is hampered by a significant number of underperforming middle and alternative schools. Operational stability is threatened by ongoing labor friction and polarized debates over campus safety and restorative justice. Despite voter-approved bond measures for facilities, the combination of fiscal volatility and sharp achievement gaps across demographic lines places the district in a precarious transitional phase.
Schools
Santa Rosa Elementary is currently a toxic district facing an existential financial crisis that has triggered a state of emergency and aggressive 'rescue' measures to avoid total takeover. The organization suffers from a profound performance divide where a few high-performing outliers mask a systemic failure, with half of its schools rated 1/10 and district-wide math proficiency at a dismal 22%. Severe enrollment decline has led to campus closures, mass layoffs of mental health and support staff, and a breakdown in community trust exacerbated by leadership instability and perceived fiscal mismanagement. The district's move to restrict exit transfers and consolidate into 7-12 models reflects a desperate attempt to stabilize a shrinking system that is currently failing to provide consistent academic or operational quality.
Schools
School Insights for Corby/Beachwood
Below average outcomes; significant attendance and academic challenges.
School Insights
See what's really behind every school rating near Corby/Beachwood
- Individual school ratings — each school's own score with outcome context, not just a district average
- Enrollment & class size data — student-to-teacher ratio and how it compares to the state average
- Full demographics breakdown — ethnicity and gender composition for every school in the enrollment zone
- Every school in the district — all schools within the enrollment boundary ranked by rating, not just the closest one
- Grade levels & benchmarks — elementary through high school, with below/above state-average flags
No credit card required