Montecito/Happy Valley, San Rafael
Updated · 1,178 residents
Montecito/Happy Valley is a historic San Rafael neighborhood defined by its scenic, tree-lined estates and custom architecture. While the area offers exceptionally clean air and convenient access to local parks, residents should be aware of persistent traffic noise from nearby transit corridors and elevated flood risks.
Key Highlights
About Montecito/Happy Valley
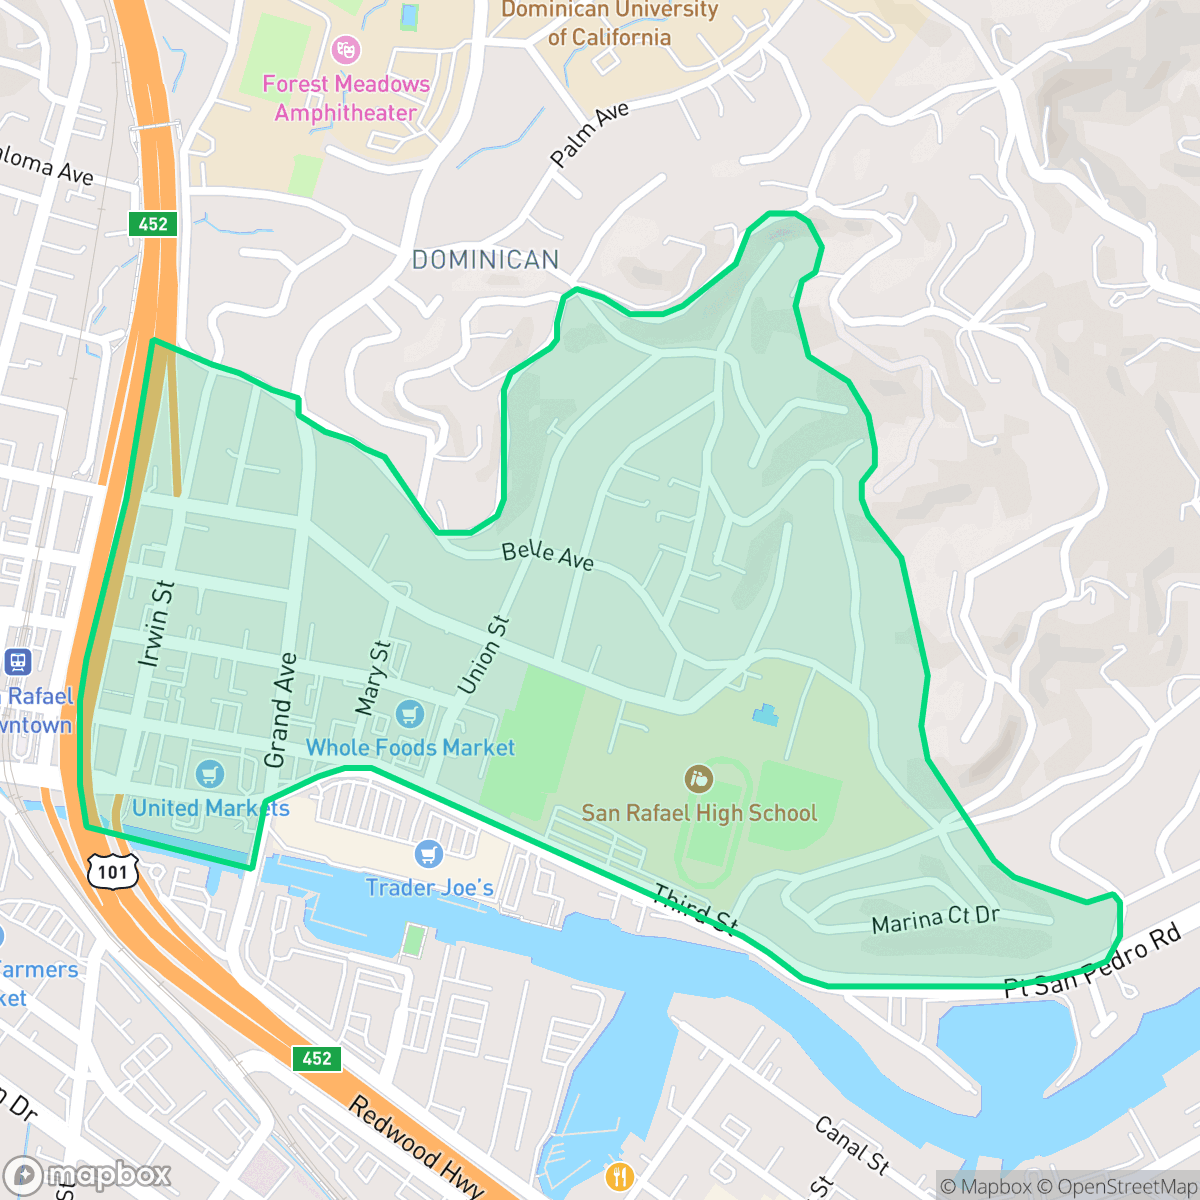
Montecito/Happy Valley, recognized as one of San Rafael’s oldest neighborhoods, is situated north of the San Rafael Canal and east of the city's downtown. Historically, the area was home to the prominent Roberts Dairy, established in 1898 by pioneer Rachel Armstrong Roberts, which operated a major creamery facility at Mary and 4th Streets until the mid-20th century. Today, the neighborhood is characterized by a blend of elegant historic homes and diverse architectural styles. Preserved through the efforts of the Montecito Area Residents Association (MARA), the community maintains a distinct identity that balances its historical legacy with modern residential and commercial activity. The area’s significance was formally acknowledged in the city’s 1996 neighborhood plan, which highlighted its role as a vital, long-standing residential hub within San Rafael.
The area offers a semi-rural aesthetic within the city, characterized by a significant tree canopy and a mix of private residential estates. Residents benefit from high-quality air and a well-connected grid system that includes pedestrian bridges for navigating to nearby amenities. The community maintains a lively social atmosphere with a variety of local cafes and dining options, though the layout remains largely car-dependent for daily errands. According to iHuus data, the neighborhood provides a unique blend of dense hillside living and proximity to wildland park areas.
Prospective residents should weigh the appeal of its aesthetic beauty and strong community identity against specific trade-offs. The neighborhood experiences noticeable noise from nearby freeway and railroad activity, and portions of the area are situated within a 100-year floodplain. Families should note that local schools are currently navigating a period of fiscal transition and performance variability. This neighborhood is well-suited for those who prioritize a scenic, liberal-leaning community with strong recreational access, provided they are comfortable with the inherent environmental and acoustic realities of the location.
Neighborhood Scores Across 15 Qualities
Housing density varies across the area, ranging from tighter downtown lots to large hillside estates with significant vegetation buffers. According to iHuus data, this provides slightly more privacy than the San Rafael average due to the presence of more spaced out properties.
Pedestrian bridges over the highway and a navigable grid system provide easy access to local parks and amenities. Connectivity is roughly in line with the San Rafael average, featuring sidewalks on select streets and buffered residential roads.
Private estates featuring custom architecture and expansive grounds provide a highly aesthetic environment that sits well above the San Rafael average. According to iHuus data, the area is characterized by significant privacy buffers and high-quality recreational amenities like private pools and tennis courts.
Wooded areas and sports fields provide ample space for walking pets, though overall dog friendliness is slightly below the San Rafael average. Access to trails in the northwest and open spaces in the northeast makes the area suitable for active dog owners.
Residential pockets feature significant tree canopy and scattered homes amid woodland or fields. This area is slightly less open than the San Rafael average, offering a blend of dense hillside living and proximity to wildland park areas.
Diverse dining options and local social spots create a notably more lively atmosphere than the San Rafael average. While various eateries and cafes provide steady activity, the car-dependent street layouts limit the ability to navigate these hubs on foot.
Frequent noise from nearby freeway and railroad activity characterizes this area. According to iHuus data, acoustic comfort levels are lower than the San Rafael average.
Air quality remains consistently high with minimal pollutants, performing even better than the San Rafael average according to iHuus data.
Industrial presence is virtually non-existent here, as the area consists of residential and recreational spaces with no detectable warehouses or heavy manufacturing. This lack of industrial activity is even more pronounced than in the rest of San Rafael according to iHuus data.
Health insurance access remains strong for most residents, though it sits slightly below the San Rafael average according to iHuus data.
Voting patterns and census indicators show a deeply liberal political leaning that is consistent with the rest of San Rafael. According to iHuus data, the ideological landscape here aligns closely with the city average.
A balanced blend of young adults, families, and seniors characterizes the local community. This demographic distribution is roughly in line with the San Rafael average, according to iHuus data.
Property within the 100-year floodplain carries an elevated risk of flooding; according to iHuus data, this vulnerability is slightly higher than the San Rafael city average.
Address-Level Insights for Montecito/Happy Valley


iHuus Neighborhood Intelligence Insights
Get address-level neighborhood insights for Montecito/Happy Valley
- Street-level scores — see how individual blocks compare, not just neighborhood averages
- Micro-zone boundaries — identify quiet pockets, flood boundaries, and walkable clusters before you visit
- 15 dimensions in full — walkability, noise, air quality, school quality, insurance coverage, population age profile, urban/rural index, and more
- Boundary risk alerts — know if your address sits near a block boundary where scores drop, the kind of detail no listing will ever mention
- School insights — individual school ratings and insights, not just district-level data
- Compare before you commit — side-by-side data across neighborhoods, down to block precision
No credit card required
Compare with Any Neighborhood
| Dimension | Montecito/Happy Valley | Bay Islands |
|---|---|---|
| 🚶 Walkabilityavg 7.77 | ||
| 🔊 Acoustic Comfortavg 4.28 | ||
| 🤫 Privacy Indexavg 5.75 | ||
| 🎨 Visual Appealavg 7.83 | ||
| 🐕 Dog Friendlinessavg 8.65 | ||
| 🗺️ Urban-Rural Indexavg 7.61 | ||
| ✨ Neighborhood Vibeavg 4 | ||
| 🏥 Health Insurance Coverageavg 7.38 | ||
| 🌿 Air Qualityavg 9.29 | ||
| 🏭 Industrial Proximityavg 9.06 | ||
| 🌊 Flood Safetyavg 3.6 | ||
| 🗳️ Ideological Leanavg 9.8 | ||
| 👥 Population Age Profileavg 5.25 | ||
| 🔥 Fire Safetyavg 1.32 | ||
| 🏫 School Quality |
Montecito/Happy Valley Rankings
School Districts Serving Montecito/Happy Valley
School Insights for Montecito/Happy Valley
Below average outcomes; significant attendance and academic challenges.
School Insights
See what's really behind every school rating near Montecito/Happy Valley
- Individual school ratings — each school's own score with outcome context, not just a district average
- Enrollment & class size data — student-to-teacher ratio and how it compares to the state average
- Full demographics breakdown — ethnicity and gender composition for every school in the enrollment zone
- Every school in the district — all schools within the enrollment boundary ranked by rating, not just the closest one
- Grade levels & benchmarks — elementary through high school, with below/above state-average flags
No credit card required