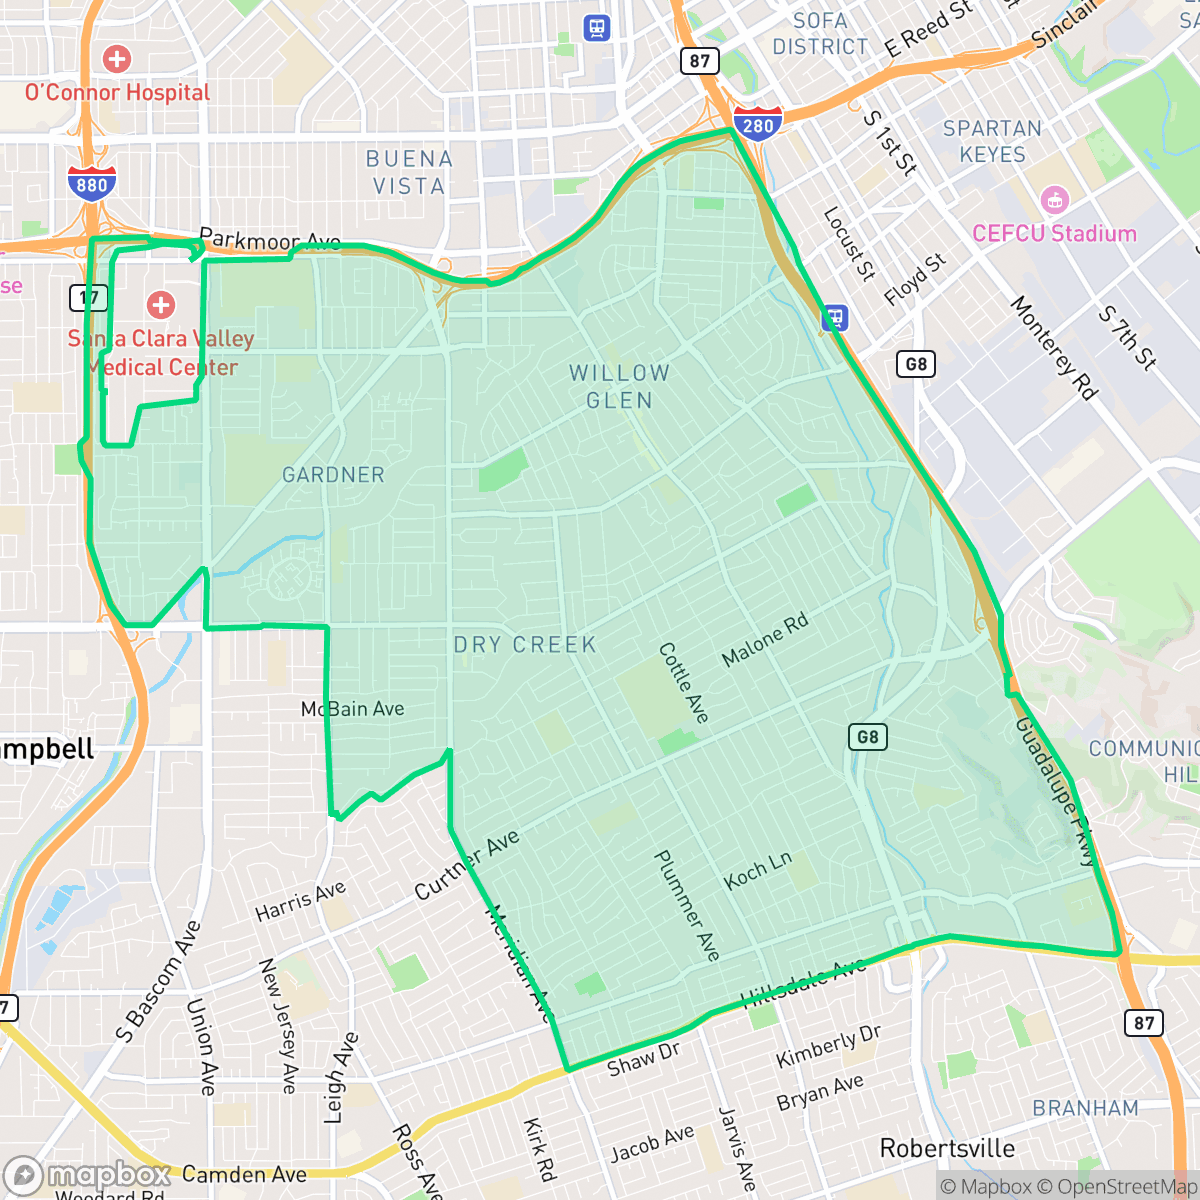
Willow Glen, San Jose
Updated June 22, 2026 · 73,734 residents
Willow Glen is a historic San Jose neighborhood defined by its well-preserved early 20th-century architecture and a walkable, tree-lined street grid. While residents enjoy easy access to local shops along Lincoln Avenue, the area remains a quiet, dense suburban enclave with limited privacy between closely spaced homes.
Key Highlights
About Willow Glen
Originally an agricultural hub renowned for its vast prune and apricot orchards, Willow Glen was annexed by San Jose in 1927. The neighborhood is defined by its distinct architectural heritage, featuring a high concentration of early 20th-century Craftsman, Spanish Colonial Revival, and Tudor Revival homes. Lincoln Avenue serves as the historic commercial heart, maintaining a small-town atmosphere that distinguishes it from the surrounding urban sprawl. The area’s name derives from the dense willow trees that once lined the nearby Los Gatos Creek, which played a central role in the region's early irrigation. Today, Willow Glen retains its identity through preserved historic districts and community-focused traditions, reflecting its transition from a rural fruit-growing center to a cherished residential enclave.
The neighborhood functions as a distinct residential community that balances its historic identity with the demands of modern suburban life. The streetscape is characterized by a high degree of visual appeal, featuring manicured lawns and frequent backyard pools, while a comprehensive sidewalk network supports high walkability for daily errands. According to iHuus data, the area maintains a peaceful atmosphere despite the proximity of major transit corridors, which contribute to a moderate level of road noise. While the density of housing results in limited privacy between neighboring properties, the neighborhood remains a sought-after location for those prioritizing an established community feel over expansive, secluded lots. Educational opportunities vary significantly across the area, with top-performing institutions like Booksin Elementary serving as anchors for local families, while other schools face performance challenges. Prospective residents should note that while the neighborhood is highly walkable, the overall rhythm of the area is relatively quiet and car-oriented for many daily services. The combination of mature tree canopies and consistent green verges makes the area suitable for dog owners, though the lack of large, open-range public spaces is a trade-off for the dense residential layout.
Neighborhood Scores Across 15 Qualities
Residential spacing is typical for the area, featuring a mix of detached homes with small yards and multi-unit complexes with shared walls. This level of density is in line with the San Jose average.
Comprehensive sidewalk networks and clear pedestrian crossings facilitate easy movement throughout residential and commercial zones. While much of the area is very walkable, large highway infrastructure and high-traffic arterials can occasionally disrupt the pedestrian experience, making the level of walkability slightly below the San Jose average.
Well-maintained properties featuring large homes, manicured lawns, and frequent private backyard pools characterize this area. The neighborhood offers a slightly more polished aesthetic than the San Jose average.
Public parks and accessible green verges along sidewalks provide decent walking options for pets, though this availability is slightly below the San Jose average.
Dense suburban layouts featuring a mix of single-family homes, apartment complexes, and commercial corridors characterize this area. This level of development is roughly in line with the typical density found across San Jose.
Suburban streets and green spaces offer a serene environment, but limited business density makes most errands car-dependent. This area features a lower level of activity and fewer walkable amenities than the San Jose average.
Persistent noise from nearby railroad tracks and heavy traffic on major thoroughfares characterizes this area. According to iHuus data, acoustic comfort levels are slightly lower than the San Jose average.
Air quality in this area is generally acceptable, though sensitive individuals may experience occasional concern on certain days. This level of air quality is roughly consistent with the broader San Jose area, according to iHuus data.
Industrial presence is minimal, as the area consists primarily of residential, commercial, and institutional uses with no significant heavy manufacturing or hazardous warehouses. While some portions near the highway interchange may experience noise from transit infrastructure, the neighborhood is largely free of industrial hazards and is comparable to the city average for low industrial density.
Health insurance coverage among residents is high, although it sits slightly below the San Jose average according to iHuus data.
Voting patterns and census indicators show a predominantly liberal political lean that is slightly more pronounced than the San Jose average, according to iHuus data.
A diverse range of age groups resides here, ranging from young professionals to seniors. According to iHuus data, this demographic spread is consistent with the broader San Jose population.
Properties in this area are located within a designated floodplain, which may necessitate flood insurance. According to iHuus data, the risk level in Willow Glen is slightly higher than the San Jose average.
Block-Level Insights for Willow Glen

iHuus Neighborhood Intelligence Insights
Get block-level neighborhood insights for Willow Glen
- Street-level scores — see how individual blocks compare, not just neighborhood averages
- Micro-zone boundaries — identify quiet pockets, flood boundaries, and walkable clusters before you visit
- 15 dimensions in full — walkability, noise, air quality, school quality, insurance coverage, population age profile, urban/rural index, and more
- Boundary risk alerts — know if your address sits near a block boundary where scores drop, the kind of detail no listing will ever mention
- School insights — individual school ratings and insights, not just district-level data
- Compare before you commit — side-by-side data across neighborhoods, down to block precision
No credit card required
Compare with Any Neighborhood
| Dimension | Willow Glen | Almaden Valley |
|---|---|---|
| 🚶 Walkabilityavg 9.17 | ||
| 🔊 Acoustic Comfortavg 3.12 | ||
| 🤫 Privacy Indexavg 4.96 | ||
| 🎨 Visual Appealavg 6.7 | ||
| 🐕 Dog Friendlinessavg 6.94 | ||
| 🗺️ Urban-Rural Indexavg 6.64 | ||
| ✨ Neighborhood Vibeavg 4.74 | ||
| 🏥 Health Insurance Coverageavg 8.07 | ||
| 🌿 Air Qualityavg 6.07 | ||
| 🏭 Industrial Proximityavg 8.85 | ||
| 🌊 Flood Safetyavg 1.56 | ||
| 🗳️ Ideological Leanavg 9.4 | ||
| 👥 Population Age Profileavg 4.88 | ||
| 🔥 Fire Safetyavg 0.17 | ||
| 🏫 School Quality |
Willow Glen Rankings
School Districts Serving Willow Glen
Cambrian Elementary School District is a premier educational entity characterized by elite academic performance, robust community backing, and high-functioning specialized programs like the Steindorf STEAM magnet. With all schools in the district scoring in the top 10-20% statewide and a clear track record of fiscal transparency and safety, the district serves as a significant anchor for property values and community stability in the San Jose area. Despite regional economic pressures on teacher retention and the sunsetting of pandemic-era funding, CESD remains a 'Blue Chip' district with no significant operational red flags or performance disparities.
Schools
Campbell Union High School District is a highly stable and academically robust organization, characterized by a portfolio of top-tier 'terminal' high schools that consistently outperform state benchmarks. The district demonstrates strong operational health through successful bond-funded modernizations, the comprehensive expansion of student wellness centers, and a clear commitment to specialized pathways like IB and STEM. Although it faces regional challenges regarding teacher retention and high academic stress levels, the district maintains high community trust and a 'Solid' rating due to its academic consistency and proactive leadership.
Schools
Campbell Union Elementary School District is a stable but bifurcated organization characterized by high-performing flagship schools and significant academic underperformance in its lower-tier campuses. While the district maintains strong community financial support through the Measure Z bond, it is currently navigating a period of internal friction focused on administrative spending and fiscal transparency. Academically, CUSD outperforms state averages in core proficiencies, yet it remains shadowed by a 60-point proficiency gap between its top and bottom schools. The district is structurally sound but faces transition challenges as it attempts to balance executive costs with classroom needs and address persistent socioeconomic disparities across its diverse student body.
Schools
East Side Union High School District is a large, diverse system characterized by a sharp academic divide and looming fiscal pressures. While flagship campuses like Evergreen Valley and Piedmont Hills offer world-class STEM and college-prep environments, the district's overall health is hampered by declining enrollment, budgetary shortfalls, and significant performance disparities across its sixteen high schools. Leadership is taking proactive steps toward staff retention and facility modernization through bond measures, but chronic absenteeism and a widening 'two-tiered' resource gap between neighborhood schools remain critical operational challenges.
Schools
Luther Burbank Elementary School District is a stable but average single-school entity that benefits from high community engagement and dedicated staff while struggling with the financial and academic pressures of its small scale. While test scores are notably lower than affluent neighbors and the district faces budget hurdles due to declining enrollment, it maintains a safe, inclusive environment and enjoys a high level of parental trust. The district currently sits in a transitional phase, seeking to modernize facilities and improve literacy rates, but it avoids the red flags of administrative instability or significant financial distress, positioning it as a resilient community-centric organization.
Schools
San Jose Unified is a 'Mixed/Transition' district defined by a significant performance gap between its prestigious southern campuses and its struggling alternative and neighborhood schools. While the district maintains strong English and Math proficiency levels compared to state averages and boasts highly sought-after specialized programs like IB and Spanish Immersion, it faces looming fiscal deficits as pandemic relief funds expire. Recent operational stability is offset by community concerns regarding teacher retention in a high-cost environment and the persistent 'good school vs. bad school' divide. The district remains a solid choice for families in specific high-performing feeder zones but faces systemic challenges in ensuring equity and long-term financial health.
Schools
Franklin-McKinley Elementary School District is currently in a state of operational distress, characterized by a staggering $23 million budget deficit and a 40% decline in student enrollment since 2011. While the district boasts a few high-performing institutions like College Connection Academy, the broader portfolio suffers from significant academic underperformance, with the majority of schools ranking in the bottom half of state proficiency metrics. Fiscal instability has led to contentious school consolidation plans and administrative friction regarding transparency and parental rights. Despite maintaining strong specialized programs like Spanish Dual Language Immersion, the district’s reliance on upcoming bond measures and restrictive transfer policies underscores a fragile organizational health that is struggling to balance specialized successes against systemic financial and academic decline.
Schools
School Insights for Willow Glen
Below average outcomes; significant attendance and academic challenges.
School Insights
See what's really behind every school rating near Willow Glen
- Individual school ratings — each school's own score with outcome context, not just a district average
- Enrollment & class size data — student-to-teacher ratio and how it compares to the state average
- Full demographics breakdown — ethnicity and gender composition for every school in the enrollment zone
- Every school in the district — all schools within the enrollment boundary ranked by rating, not just the closest one
- Grade levels & benchmarks — elementary through high school, with below/above state-average flags
No credit card required