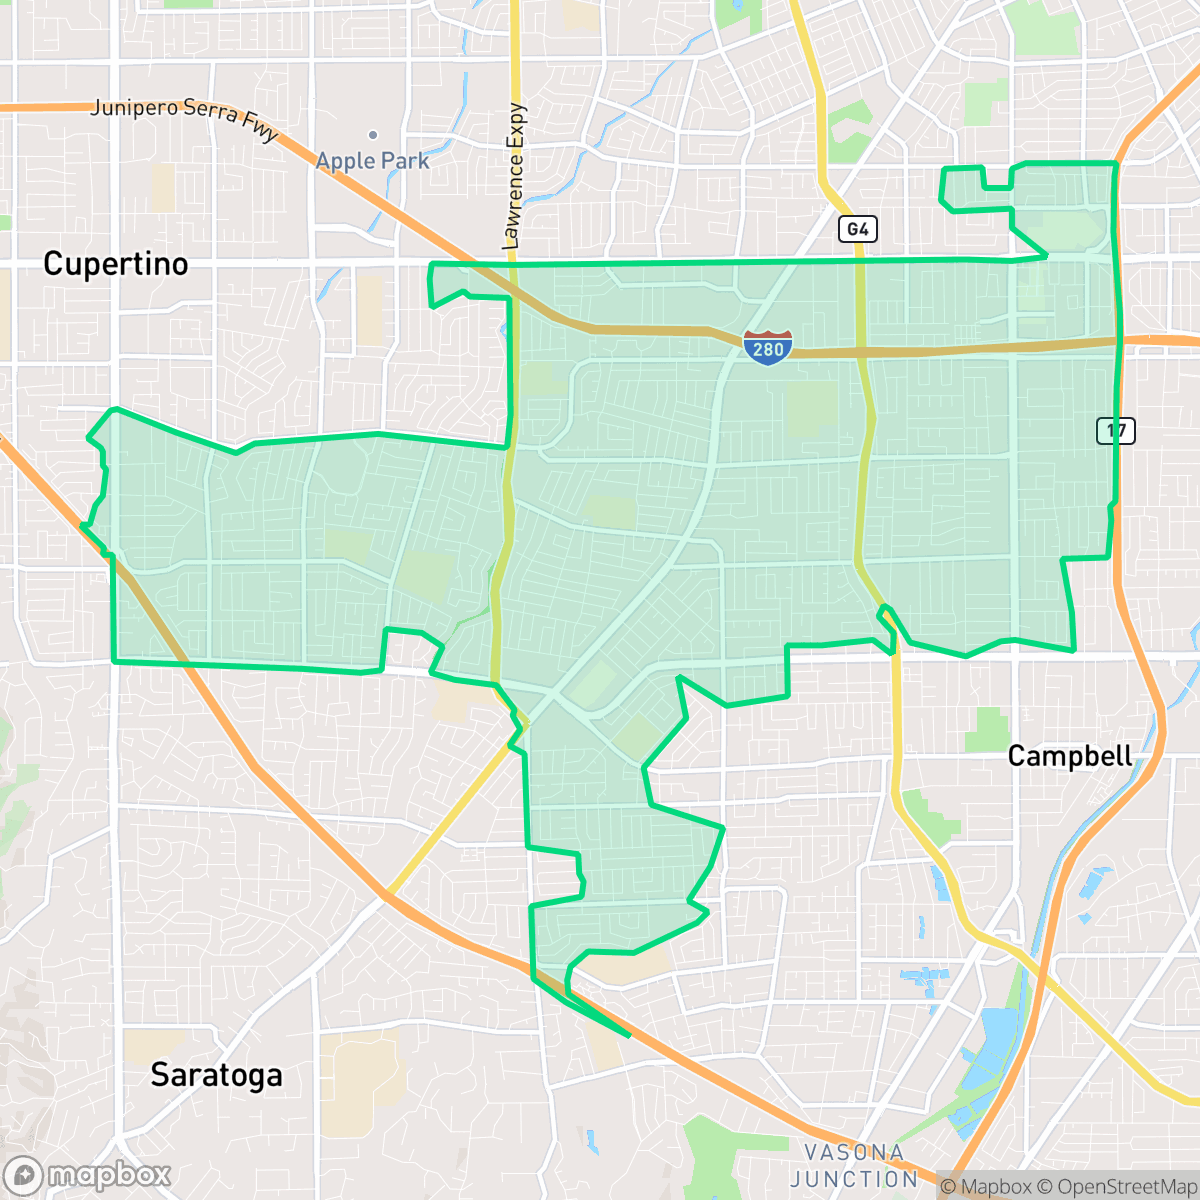
West San Jose, San Jose
Updated June 22, 2026 · 93,663 residents
West San Jose is defined by iconic landmarks like the Winchester Mystery House and the vibrant, mixed-use atmosphere of Santana Row. The area features a highly walkable environment with a dense network of suburban residential streets, though residents often experience significant noise from nearby highway traffic.
Key Highlights
About West San Jose
West San Jose evolved from the expansive prune and apricot orchards that once defined the Santa Clara Valley. Following World War II, the area underwent rapid suburbanization, transforming agricultural land into residential subdivisions and commercial corridors. A defining landmark is the Winchester Mystery House, a sprawling, eccentric Victorian mansion built by Sarah Winchester, which remains a significant cultural site. The neighborhood's character was further reshaped by the redevelopment of the former Town & Country Village into Santana Row, a major mixed-use urban village that redefined the area's commercial landscape. Today, West San Jose serves as a hub of suburban residential life, marked by its transition from the agricultural roots of the 'Valley of Heart's Delight' to a modern, densely developed urban environment.
This neighborhood functions as a central hub of suburban activity, blending established residential tracts with major commercial corridors. While the area offers high walkability and excellent access to public amenities, the layout is characterized by relatively high-density housing where homes are frequently spaced within 10 to 15 meters of one another. The presence of significant retail and dining clusters provides a lively atmosphere, though the proximity to major thoroughfares contributes to elevated noise levels throughout many residential blocks.
For prospective residents, the area is best suited for those who prioritize proximity to Silicon Valley employment centers and access to high-performing school districts such as the Fremont Union High School District. While the neighborhood lacks large-scale industrial hazards, the trade-off for its central location is a noticeable acoustic footprint from road traffic. According to iHuus data, the area maintains a strong sense of community through its well-connected sidewalk network and numerous local parks, making it a functional choice for families and professionals seeking a balance between suburban comfort and urban convenience.
Neighborhood Scores Across 15 Qualities
Residential spacing varies between detached homes with private yards and denser apartment clusters with shared walls. This level of density is slightly higher than the San Jose average, offering a mix of suburban setbacks and closely packed multi-family units.
Continuous sidewalks and clear crosswalks are available on both sides of most streets, including major arterials and residential areas. This dense pedestrian network offers superior connectivity for walkers compared to the San Jose average.
Manicured landscapes, large residential lots, and frequent private pools create an upscale visual environment that is slightly above the San Jose average. Many properties feature well-maintained grounds and spacious driveways, though some areas transition into denser, more uniform tract housing.
Abundant public parks, school athletic fields, and wide grassy sidewalk verges provide plenty of space for exercise. This level of access to green space is consistent with the city average.
Established suburban development characterizes this area, featuring a consistent mix of single-family homes, apartment complexes, and commercial centers. This landscape is very similar to the broader San Jose urban fabric, offering a standard suburban density.
Diverse dining and local amenities provide more activity than the city average, though much of the area remains quiet and car-dependent. While some pockets feature lively social hubs and walkable paths, other blocks are primarily composed of calm, residential streets with sparse business access.
Frequent noise from nearby freeways and railroad tracks characterizes this area. According to iHuus data, acoustic comfort in West San Jose is slightly below the San Jose average.
Air quality fluctuates between acceptable and unhealthy levels, presenting occasional concerns for sensitive groups. This condition is roughly in line with the average seen across San Jose.
Residential and retail spaces dominate this area with no detectable warehouses or heavy manufacturing facilities. This lack of industrial activity provides a cleaner environment than the city average, according to iHuus data.
Health insurance access is widespread among residents, performing slightly above the San Jose average according to iHuus data.
Voting patterns and census indicators show a predominantly liberal leaning that is slightly higher than the San Jose average, according to iHuus data.
A balanced mix of young professionals, families, and older residents characterizes this area, mirroring the overall demographic spread found across San Jose.
Properties in this area are situated within a designated floodplain, which may necessitate the purchase of flood insurance. According to iHuus data, this level of flood risk is higher than the average for San Jose.
Block-Level Insights for West San Jose

iHuus Neighborhood Intelligence Insights
Get block-level neighborhood insights for West San Jose
- Street-level scores — see how individual blocks compare, not just neighborhood averages
- Micro-zone boundaries — identify quiet pockets, flood boundaries, and walkable clusters before you visit
- 15 dimensions in full — walkability, noise, air quality, school quality, insurance coverage, population age profile, urban/rural index, and more
- Boundary risk alerts — know if your address sits near a block boundary where scores drop, the kind of detail no listing will ever mention
- School insights — individual school ratings and insights, not just district-level data
- Compare before you commit — side-by-side data across neighborhoods, down to block precision
No credit card required
Compare with Any Neighborhood
| Dimension | West San Jose | Almaden Valley |
|---|---|---|
| 🚶 Walkabilityavg 9.17 | ||
| 🔊 Acoustic Comfortavg 3.12 | ||
| 🤫 Privacy Indexavg 4.96 | ||
| 🎨 Visual Appealavg 6.7 | ||
| 🐕 Dog Friendlinessavg 6.94 | ||
| 🗺️ Urban-Rural Indexavg 6.64 | ||
| ✨ Neighborhood Vibeavg 4.74 | ||
| 🏥 Health Insurance Coverageavg 8.07 | ||
| 🌿 Air Qualityavg 6.07 | ||
| 🏭 Industrial Proximityavg 8.85 | ||
| 🌊 Flood Safetyavg 1.56 | ||
| 🗳️ Ideological Leanavg 9.4 | ||
| 👥 Population Age Profileavg 4.88 | ||
| 🔥 Fire Safetyavg 0.17 | ||
| 🏫 School Quality |
West San Jose Rankings
School Districts Serving West San Jose
Fremont Union High School District is a premier 'Blue Chip' organization characterized by exceptional academic results, state-of-the-art facilities, and high community confidence. While it navigates the regional challenges of high housing costs and a 2% annual enrollment decline, the district remains a top-tier destination with high schools that consistently rank in the national top 10%. Administrative stability is reflected in proactive wellness initiatives and successful facility upgrades at Fremont and Homestead. Despite the intense academic pressure reported by students, the district's 'A+' standing, robust extracurricular ecosystem, and fiscal resilience solidify its status as a leading educational entity.
Schools
Campbell Union High School District is a highly stable and academically robust organization, characterized by a portfolio of top-tier 'terminal' high schools that consistently outperform state benchmarks. The district demonstrates strong operational health through successful bond-funded modernizations, the comprehensive expansion of student wellness centers, and a clear commitment to specialized pathways like IB and STEM. Although it faces regional challenges regarding teacher retention and high academic stress levels, the district maintains high community trust and a 'Solid' rating due to its academic consistency and proactive leadership.
Schools
CUSD remains an academic powerhouse with test scores in the top 1% of California, bolstered by a portfolio of exceptionally high-performing schools and a robust STEM curriculum. Despite its 'Blue Chip' academic standing, the district is currently categorized as 'Solid/Stable' (4) rather than a 5 due to significant fiscal volatility and declining enrollment. Operational health is strained by a multi-million dollar deficit and controversial cost-cutting measures, including staff layoffs and program closures like the CuperDoodle Preschool. While the district remains solvent and highly desirable for families, the ongoing friction between its 'basic aid' funding model and state mandates, coupled with a perceived lack of administrative transparency, indicates a period of transition and tightening constraints.
Schools
Moreland School District is a high-performing, stable organization characterized by top-tier academic outcomes in its premier campuses and a strong reputation for STEAM education in West San Jose. While it maintains an 'A' grade profile and enjoys high levels of community trust and financial stability, a noticeable performance gap exists between its elite schools and a few lower-performing elementary sites. The district successfully navigates the high-pressure environment of Silicon Valley with robust leadership and modern facilities, making it a highly desirable destination for families despite the regional challenges of teacher retention and internal academic variance.
Schools
Campbell Union Elementary School District is a stable but bifurcated organization characterized by high-performing flagship schools and significant academic underperformance in its lower-tier campuses. While the district maintains strong community financial support through the Measure Z bond, it is currently navigating a period of internal friction focused on administrative spending and fiscal transparency. Academically, CUSD outperforms state averages in core proficiencies, yet it remains shadowed by a 60-point proficiency gap between its top and bottom schools. The district is structurally sound but faces transition challenges as it attempts to balance executive costs with classroom needs and address persistent socioeconomic disparities across its diverse student body.
Schools
San Jose Unified is a 'Mixed/Transition' district defined by a significant performance gap between its prestigious southern campuses and its struggling alternative and neighborhood schools. While the district maintains strong English and Math proficiency levels compared to state averages and boasts highly sought-after specialized programs like IB and Spanish Immersion, it faces looming fiscal deficits as pandemic relief funds expire. Recent operational stability is offset by community concerns regarding teacher retention in a high-cost environment and the persistent 'good school vs. bad school' divide. The district remains a solid choice for families in specific high-performing feeder zones but faces systemic challenges in ensuring equity and long-term financial health.
Schools
Santa Clara Unified School District is a high-performing academic entity currently navigating a period of significant fiscal instability. While the district boasts prestigious schools with ratings reaching 10/10 and showing year-over-year gains in state testing, it is grappling with a $30 million budget deficit and a projected enrollment decline. The unanimous board approval of over 100 staff layoffs in early 2026 highlights a necessary but painful 'rightsizing' phase. Despite these financial pressures, the district remains a destination for families due to its robust high school offerings and innovative teacher housing initiatives, though its long-term operational health depends on successfully stabilizing its budget and reserves.
Schools
School Insights for West San Jose
Below average outcomes; significant attendance and academic challenges.
School Insights
See what's really behind every school rating near West San Jose
- Individual school ratings — each school's own score with outcome context, not just a district average
- Enrollment & class size data — student-to-teacher ratio and how it compares to the state average
- Full demographics breakdown — ethnicity and gender composition for every school in the enrollment zone
- Every school in the district — all schools within the enrollment boundary ranked by rating, not just the closest one
- Grade levels & benchmarks — elementary through high school, with below/above state-average flags
No credit card required