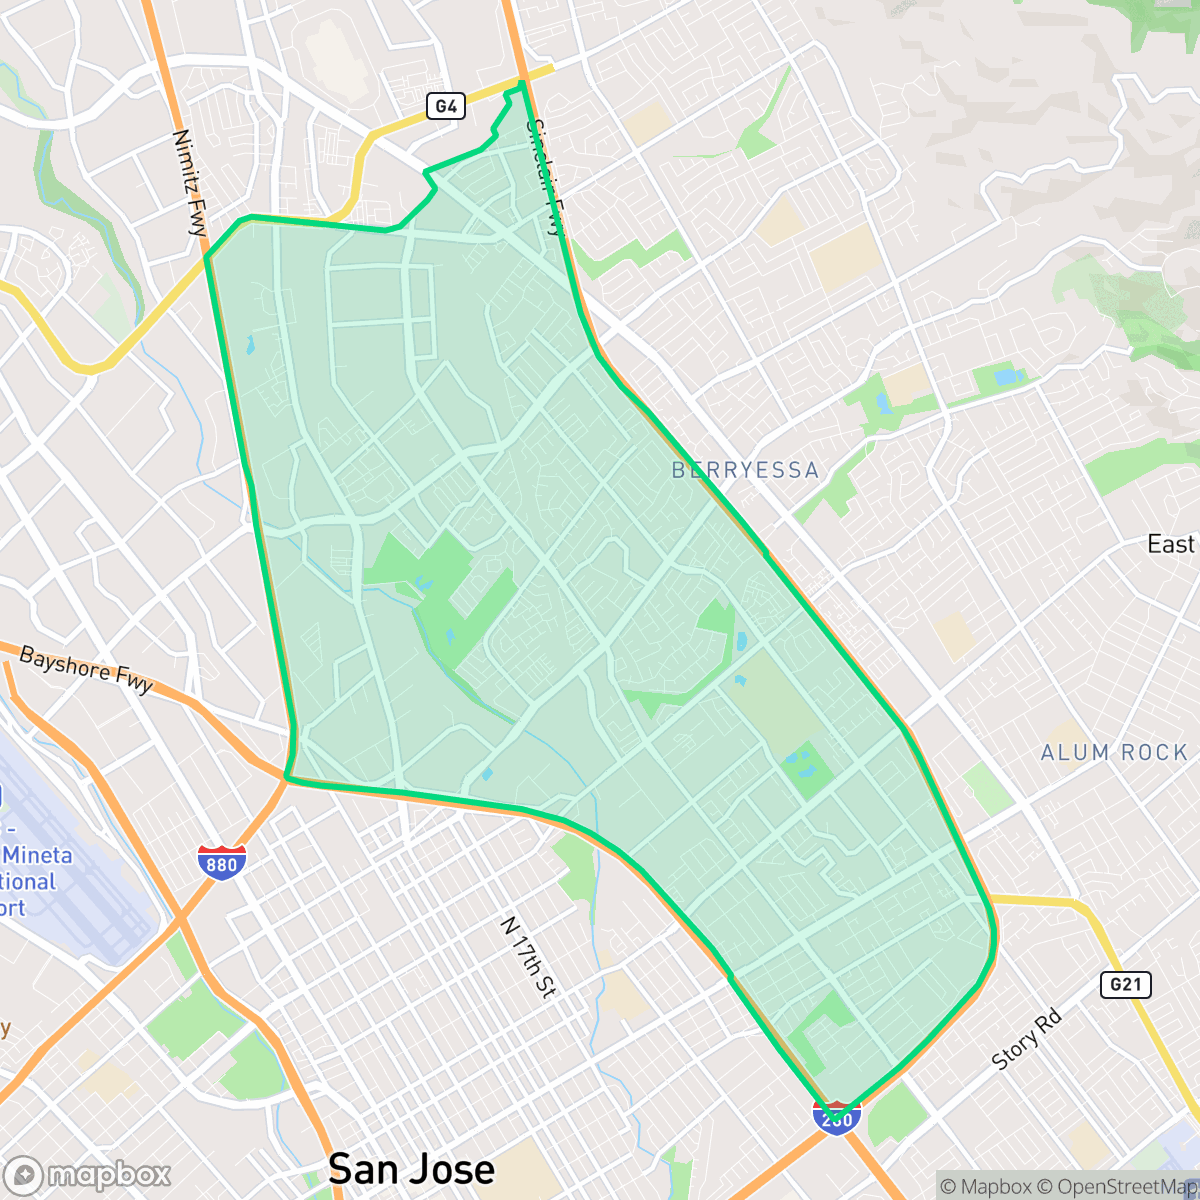
North Valley, San Jose
Updated June 22, 2026 · 78,006 residents
North Valley is a contemporary suburban district defined by high-density residential clusters and proximity to major Silicon Valley tech corridors. While the area offers a highly walkable grid of sidewalks and access to local parks, residents should expect notable noise levels from nearby highway traffic and a dense, shared-wall living environment.
Key Highlights
About North Valley
The North Valley neighborhood of San Jose is a modern residential and industrial district defined primarily by its late 20th-century development. Historically, the broader North San Jose region remained largely agricultural, characterized by extensive orchards, until the rapid expansion of the technology sector in the 1970s. Unlike older, historic districts in the city, North Valley’s current character emerged as a response to the Silicon Valley tech boom, resulting in a landscape of high-density housing, townhomes, and condos built predominantly from the 1990s to the present. The area’s architectural identity is marked by Spanish Revival and New Traditional styles, reflecting its transition from farmland to a contemporary suburban hub for tech commuters. It lacks the deep-rooted historical landmarks or distinct cultural institutions found in San Jose’s older, established neighborhoods.
The area functions as a modern hub for tech commuters, characterized by a dense mix of tract housing, apartment complexes, and light industrial zones. The landscape is dominated by uniform suburban architecture, where residential blocks are interspersed with large-scale logistics facilities and commercial warehouses. Despite the suburban feel, the neighborhood maintains a consistent network of sidewalks and pedestrian paths, providing access to community green spaces and local dining options. Prospective residents should consider the trade-offs of living in such a high-density environment, which includes limited privacy due to closely spaced homes and shared-wall construction. The area is significantly impacted by road noise from the surrounding highway infrastructure, which contributes to a lower acoustic comfort level. While the neighborhood offers proximity to diverse schools and regional transit, it is best suited for those who prioritize convenience and accessibility to Silicon Valley employment centers over quiet, secluded living.
Neighborhood Scores Across 15 Qualities
Residential spacing varies from shared-wall townhomes to detached houses with modest buffers. According to iHuus data, neighbor separation is slightly lower than the San Jose average.
Extensive sidewalk networks and clear pedestrian crossings are available throughout residential blocks, although a major highway interchange divides certain sections of the area. While pedestrian infrastructure is robust, the connectivity is slightly lower than the San Jose average due to these high-traffic barriers.
Uniform tract housing and multi-family complexes define the landscape, offering a functional aesthetic that is slightly below the San Jose average. The area features consistent rooflines and shared amenities, though it lacks the large private estates found in more affluent parts of the city.
Frequent access to large public parks, golf course greens, and walking trails provides ample space for dogs, though the area sits slightly below the San Jose average for overall dog friendliness. While many residential blocks feature narrow sidewalk verges, the presence of central green corridors and community parks offers reliable opportunities for pet exercise.
Residential street grids and single-family homes are interspersed with large-scale commercial warehouses and industrial zones. This landscape offers a suburban feel that is largely consistent with the broader San Jose area.
A steady rhythm of residential life and light industrial activity defines the area, offering a calm atmosphere that is largely in line with the rest of San Jose. While some pockets feature diverse dining and social spots, many parts of the neighborhood are car-dependent with limited businesses within walking distance.
Frequent noise from nearby freeways and railroad tracks characterizes this area. According to iHuus data, acoustic comfort is notably lower than the San Jose average.
Air quality in this area fluctuates between acceptable and unhealthy levels, which is slightly lower than the San Jose average according to iHuus data. Sensitive groups may experience occasional concern during certain periods.
Minimal industrial presence defines this area, as land use is primarily residential and light commercial. According to iHuus data, the neighborhood has fewer heavy industrial hazards and large-scale warehouses than the San Jose average.
Health insurance accessibility in North Valley is slightly lower than the San Jose average, according to iHuus data.
Voting patterns and census indicators show a predominantly liberal political leaning, which is consistent with the broader San Jose area according to iHuus data.
Residents live alongside a balanced mix of young professionals, families, and seniors. This demographic variety is largely consistent with the broader San Jose area according to iHuus data.
Properties in this area are located within a designated floodplain, meaning residents may face a higher risk of flooding than the San Jose average. According to iHuus data, flood insurance is typically required for homes in this zone.
Block-Level Insights for North Valley

iHuus Neighborhood Intelligence Insights
Get block-level neighborhood insights for North Valley
- Street-level scores — see how individual blocks compare, not just neighborhood averages
- Micro-zone boundaries — identify quiet pockets, flood boundaries, and walkable clusters before you visit
- 15 dimensions in full — walkability, noise, air quality, school quality, insurance coverage, population age profile, urban/rural index, and more
- Boundary risk alerts — know if your address sits near a block boundary where scores drop, the kind of detail no listing will ever mention
- School insights — individual school ratings and insights, not just district-level data
- Compare before you commit — side-by-side data across neighborhoods, down to block precision
No credit card required
Compare with Any Neighborhood
| Dimension | North Valley | Almaden Valley |
|---|---|---|
| 🚶 Walkabilityavg 9.17 | ||
| 🔊 Acoustic Comfortavg 3.12 | ||
| 🤫 Privacy Indexavg 4.96 | ||
| 🎨 Visual Appealavg 6.7 | ||
| 🐕 Dog Friendlinessavg 6.94 | ||
| 🗺️ Urban-Rural Indexavg 6.64 | ||
| ✨ Neighborhood Vibeavg 4.74 | ||
| 🏥 Health Insurance Coverageavg 8.07 | ||
| 🌿 Air Qualityavg 6.07 | ||
| 🏭 Industrial Proximityavg 8.85 | ||
| 🌊 Flood Safetyavg 1.56 | ||
| 🗳️ Ideological Leanavg 9.4 | ||
| 👥 Population Age Profileavg 4.88 | ||
| 🔥 Fire Safetyavg 0.17 | ||
| 🏫 School Quality |
North Valley Rankings
School Districts Serving North Valley
Milpitas Unified School District is a high-performing 'Blue Chip' organization characterized by exceptional academic results, a forward-thinking leadership team, and strong community financial support. With the majority of its schools achieving 9/10 or 10/10 ratings and a terminal high school that serves as a regional benchmark, MUSD maintains a stable and prestigious standing. The district is aggressively modernizing through its Innovation Campus and AI-integrated curriculum, while successfully managing labor relations through ratified pay raises. Despite minor performance gaps in two specialized schools and typical urban safety challenges, MUSD offers a rare combination of elite academic success and a balanced, collaborative culture that distinguishes it from its more high-stress Silicon Valley peers.
Schools
The Berryessa Union Elementary School District remains a high-performing academic entity characterized by strong community support and standout instructional programs like Mandarin Immersion and STEAM. While Ground Truth data reveals an impressive portfolio where most schools earn ratings between 7/10 and 10/10, the district is currently grappling with systemic Silicon Valley challenges, including declining enrollment and a projected budget deficit for 2026. Despite these fiscal headwinds and polarizing facilities conditions at certain middle schools, the district maintains high instructional standards and a safe, inclusive culture, securing its position as a desirable destination for families while entering a critical period of financial stabilization.
Schools
East Side Union High School District is a large, diverse system characterized by a sharp academic divide and looming fiscal pressures. While flagship campuses like Evergreen Valley and Piedmont Hills offer world-class STEM and college-prep environments, the district's overall health is hampered by declining enrollment, budgetary shortfalls, and significant performance disparities across its sixteen high schools. Leadership is taking proactive steps toward staff retention and facility modernization through bond measures, but chronic absenteeism and a widening 'two-tiered' resource gap between neighborhood schools remain critical operational challenges.
Schools
Orchard Elementary School District functions as a stable, single-site K-8 entity characterized by a strong sense of community and proactive fiscal management. While academic performance currently sits at a moderate level (5/10), the district shows positive momentum through successful facility modernizations, low staff turnover, and rising literacy scores. The organization effectively leverages its small size to provide individualized attention and has maintained community trust as evidenced by successful bond utilization and positive local sentiment. It remains a 'Mixed/Transition' district primarily because its small scale limits the breadth of secondary-level electives and its math performance has yet to reach elite benchmarks.
Schools
San Jose Unified is a 'Mixed/Transition' district defined by a significant performance gap between its prestigious southern campuses and its struggling alternative and neighborhood schools. While the district maintains strong English and Math proficiency levels compared to state averages and boasts highly sought-after specialized programs like IB and Spanish Immersion, it faces looming fiscal deficits as pandemic relief funds expire. Recent operational stability is offset by community concerns regarding teacher retention in a high-cost environment and the persistent 'good school vs. bad school' divide. The district remains a solid choice for families in specific high-performing feeder zones but faces systemic challenges in ensuring equity and long-term financial health.
Schools
Alum Rock Union Elementary School District is a distressed organization currently undergoing a painful consolidation to avoid a state takeover. With a $20 million budget shortfall and a dramatic loss of over half its student population since 2000, the district has been forced to close six schools and merge others, sparking significant community backlash and student attrition to neighboring districts. Academic performance is critically low across the board, with many schools receiving the lowest possible ratings and proficiency levels remaining well below state averages. Although recent fiscal measures have led to a bond rating upgrade, the district remains under high-intensity scrutiny following an extraordinary audit into potential financial fraud and ongoing administrative instability.
Schools
Franklin-McKinley Elementary School District is currently in a state of operational distress, characterized by a staggering $23 million budget deficit and a 40% decline in student enrollment since 2011. While the district boasts a few high-performing institutions like College Connection Academy, the broader portfolio suffers from significant academic underperformance, with the majority of schools ranking in the bottom half of state proficiency metrics. Fiscal instability has led to contentious school consolidation plans and administrative friction regarding transparency and parental rights. Despite maintaining strong specialized programs like Spanish Dual Language Immersion, the district’s reliance on upcoming bond measures and restrictive transfer policies underscores a fragile organizational health that is struggling to balance specialized successes against systemic financial and academic decline.
Schools
School Insights for North Valley
Below average outcomes; significant attendance and academic challenges.
School Insights
See what's really behind every school rating near North Valley
- Individual school ratings — each school's own score with outcome context, not just a district average
- Enrollment & class size data — student-to-teacher ratio and how it compares to the state average
- Full demographics breakdown — ethnicity and gender composition for every school in the enrollment zone
- Every school in the district — all schools within the enrollment boundary ranked by rating, not just the closest one
- Grade levels & benchmarks — elementary through high school, with below/above state-average flags
No credit card required