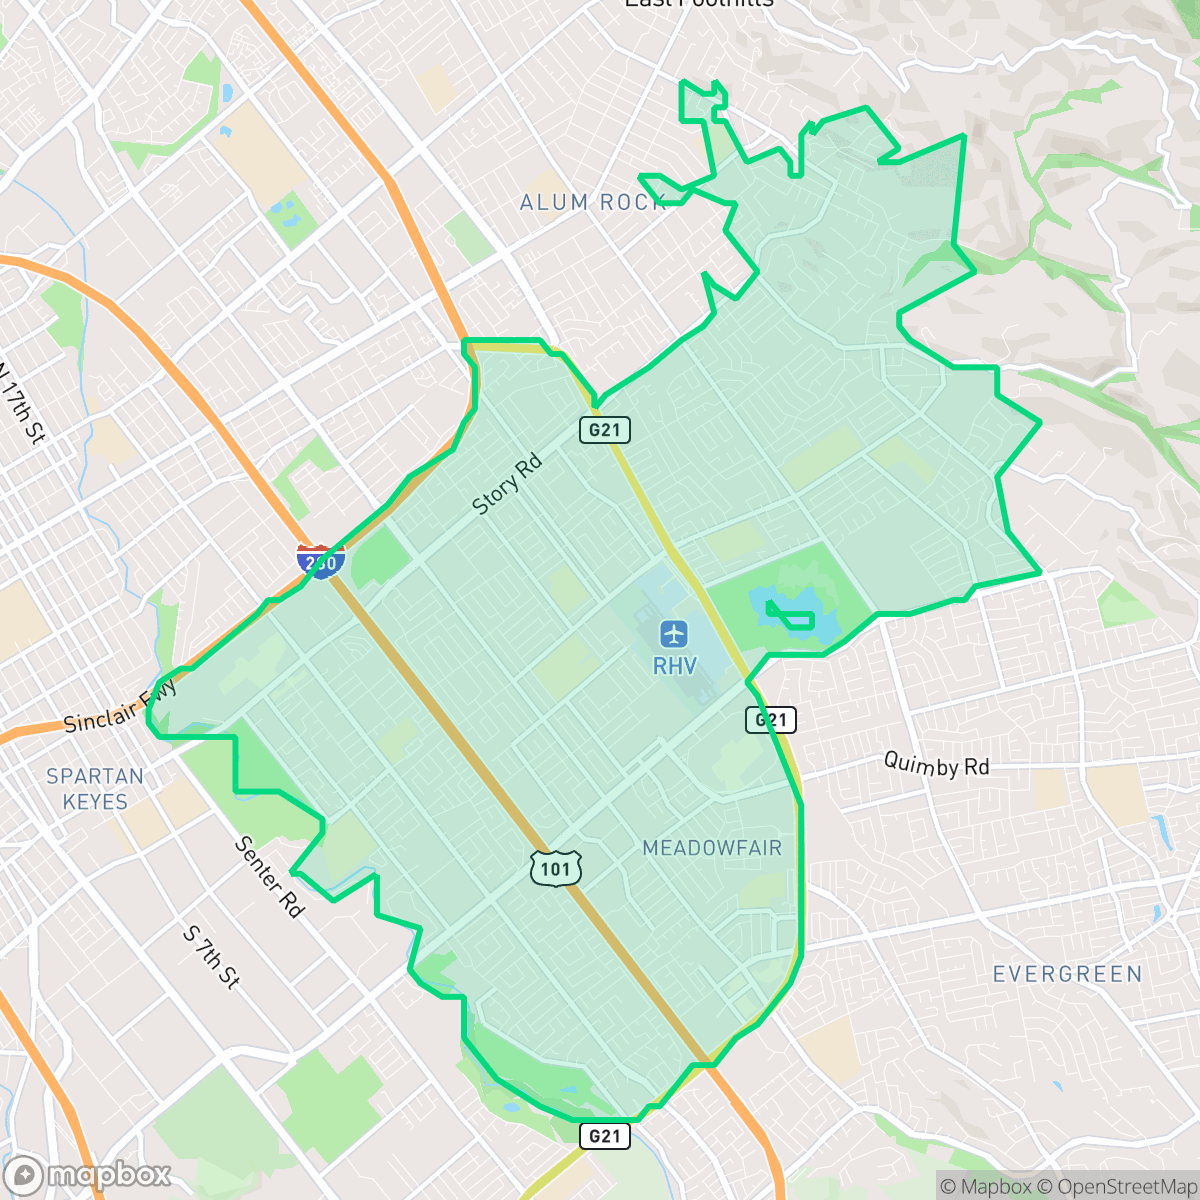
East San Jose, San Jose
Updated June 22, 2026 · 117,681 residents
East San Jose is a highly walkable community characterized by its dense residential layout and strong cultural identity. Residents benefit from a comprehensive sidewalk network and proximity to diverse local dining, though the area experiences notable road traffic noise and limited private yard space.
Key Highlights
About East San Jose
East San Jose, historically known as the 'Eastside,' evolved from a landscape of orchards and canneries into a vital hub for immigrant and working-class communities. During the mid-20th century, the area faced significant infrastructure challenges, with parts infamously nicknamed 'Sal Si Puedes' (Get Out If You Can). The neighborhood became a cradle for the Chicano civil rights movement, most notably through the activism of César Chávez, who began his organizing work at Our Lady of Guadalupe Church and McDonnell Hall. Today, East San Jose is defined by its deep-rooted Mexican-American heritage, vibrant lowrider culture, and diverse immigrant enclaves like Little Saigon. Landmark sites such as the Mexican Heritage Plaza and Emma Prusch Farm Park serve as cultural anchors, preserving the area's agrarian past and its long-standing legacy of community activism and resilience.
The neighborhood features a dense suburban landscape, primarily composed of single-family homes and multi-family complexes. It is well-connected for pedestrians, with consistent sidewalks and crosswalks throughout its residential grid. While the area is largely residential, it contains pockets of light commercial activity and diverse dining options, particularly near major corridors. According to iHuus data, the neighborhood maintains a high walkability score, facilitating easy access to community parks and school facilities.
Prospective residents should note that the high-density nature of the housing leads to close neighbor proximity and limited private outdoor space. The area faces challenges related to acoustic comfort due to road traffic and significant performance disparities across local school districts. It is best suited for those prioritizing walkability and access to community-oriented amenities over expansive private yards or quiet, low-density settings.
Neighborhood Scores Across 15 Qualities
Residential spacing is inconsistent throughout the area, ranging from detached homes with moderate buffers to high-density apartment and mobile home clusters where structures are closely packed. According to iHuus data, the level of separation between neighbors is slightly lower than the San Jose average.
Continuous sidewalk networks and clearly marked crosswalks facilitate easy pedestrian movement throughout residential and commercial blocks. This level of accessibility is on par with the San Jose average, providing safe paths through parks and school zones.
Uniform tract housing and high-density residential complexes characterize the area, offering a visual profile slightly below the San Jose average. The scenery primarily consists of modest yards and shared community amenities rather than expansive, manicured estates.
Access to large public parks, school athletic fields, and continuous green corridors provides reliable space for dog walking. This level of pet-friendly infrastructure is on par with the rest of San Jose.
A mix of single-family homes and large commercial blocks defines the landscape, which remains largely consistent with the city average. Residents will find a varied environment of residential tracts, industrial warehouses, and institutional grounds.
A balanced mix of residential streets and light industrial areas provides a consistent but low-key energy. While some pockets offer diverse dining and social hubs, many parts of the neighborhood are quiet and rely on driving for most errands.
Audible disturbances from nearby freeways and railroad tracks are common in this area. According to iHuus data, the level of acoustic disruption is consistent with the city average.
Air quality levels fluctuate between acceptable and unhealthy, presenting occasional concerns for sensitive groups. This stability is largely consistent with the average seen across San Jose, according to iHuus data.
Minimal heavy industry and hazardous sites characterize this area, which stays slightly below the city average for industrial proximity. Most sectors are dedicated to residential, institutional, or light commercial uses, providing a reprieve from large-scale manufacturing hubs.
Health insurance access among residents is slightly lower than the San Jose average, according to iHuus data.
Voting patterns and census indicators show a strong liberal leaning, which is very similar to the broader San Jose area according to iHuus data.
Residents live alongside a balanced mix of young adults, families, and older individuals. This age distribution is largely consistent with the broader San Jose area, according to iHuus data.
Flood risk in this area is significantly higher than the city average, as it includes coastal high-hazard zones subject to wave action. Residents should expect elevated or potentially prohibitive flood insurance costs according to iHuus data.
Fire safety risks in this area are notably higher than the San Jose average. Residents should account for significant fire safety concerns when evaluating property stability in this neighborhood.
Block-Level Insights for East San Jose

iHuus Neighborhood Intelligence Insights
Get block-level neighborhood insights for East San Jose
- Street-level scores — see how individual blocks compare, not just neighborhood averages
- Micro-zone boundaries — identify quiet pockets, flood boundaries, and walkable clusters before you visit
- 15 dimensions in full — walkability, noise, air quality, school quality, insurance coverage, population age profile, urban/rural index, and more
- Boundary risk alerts — know if your address sits near a block boundary where scores drop, the kind of detail no listing will ever mention
- School insights — individual school ratings and insights, not just district-level data
- Compare before you commit — side-by-side data across neighborhoods, down to block precision
No credit card required
Compare with Any Neighborhood
| Dimension | East San Jose | Almaden Valley |
|---|---|---|
| 🚶 Walkabilityavg 9.17 | ||
| 🔊 Acoustic Comfortavg 3.12 | ||
| 🤫 Privacy Indexavg 4.96 | ||
| 🎨 Visual Appealavg 6.7 | ||
| 🐕 Dog Friendlinessavg 6.94 | ||
| 🗺️ Urban-Rural Indexavg 6.64 | ||
| ✨ Neighborhood Vibeavg 4.74 | ||
| 🏥 Health Insurance Coverageavg 8.07 | ||
| 🌿 Air Qualityavg 6.07 | ||
| 🏭 Industrial Proximityavg 8.85 | ||
| 🌊 Flood Safetyavg 1.56 | ||
| 🗳️ Ideological Leanavg 9.4 | ||
| 👥 Population Age Profileavg 4.88 | ||
| 🔥 Fire Safetyavg 0.17 | ||
| 🏫 School Quality |
East San Jose Rankings
School Districts Serving East San Jose
East Side Union High School District is a large, diverse system characterized by a sharp academic divide and looming fiscal pressures. While flagship campuses like Evergreen Valley and Piedmont Hills offer world-class STEM and college-prep environments, the district's overall health is hampered by declining enrollment, budgetary shortfalls, and significant performance disparities across its sixteen high schools. Leadership is taking proactive steps toward staff retention and facility modernization through bond measures, but chronic absenteeism and a widening 'two-tiered' resource gap between neighborhood schools remain critical operational challenges.
Schools
Evergreen Elementary School District is a high-achieving but increasingly polarized organization, characterized by a sharp divide between its elite 10/10 campuses and several underperforming schools rated 4/10 or lower. While the district maintains a stellar reputation for its STEM curriculum and has proactively addressed student wellness through new mental health initiatives, it is currently grappling with the structural threat of declining enrollment and the resulting fiscal instability. Recent reports of budget stabilization plans and potential school consolidations, coupled with the high cost of living affecting teacher retention, place this traditionally 'Blue Chip' district in a state of transition that requires careful financial management to preserve its academic standing.
Schools
San Jose Unified is a 'Mixed/Transition' district defined by a significant performance gap between its prestigious southern campuses and its struggling alternative and neighborhood schools. While the district maintains strong English and Math proficiency levels compared to state averages and boasts highly sought-after specialized programs like IB and Spanish Immersion, it faces looming fiscal deficits as pandemic relief funds expire. Recent operational stability is offset by community concerns regarding teacher retention in a high-cost environment and the persistent 'good school vs. bad school' divide. The district remains a solid choice for families in specific high-performing feeder zones but faces systemic challenges in ensuring equity and long-term financial health.
Schools
Alum Rock Union Elementary School District is a distressed organization currently undergoing a painful consolidation to avoid a state takeover. With a $20 million budget shortfall and a dramatic loss of over half its student population since 2000, the district has been forced to close six schools and merge others, sparking significant community backlash and student attrition to neighboring districts. Academic performance is critically low across the board, with many schools receiving the lowest possible ratings and proficiency levels remaining well below state averages. Although recent fiscal measures have led to a bond rating upgrade, the district remains under high-intensity scrutiny following an extraordinary audit into potential financial fraud and ongoing administrative instability.
Schools
Franklin-McKinley Elementary School District is currently in a state of operational distress, characterized by a staggering $23 million budget deficit and a 40% decline in student enrollment since 2011. While the district boasts a few high-performing institutions like College Connection Academy, the broader portfolio suffers from significant academic underperformance, with the majority of schools ranking in the bottom half of state proficiency metrics. Fiscal instability has led to contentious school consolidation plans and administrative friction regarding transparency and parental rights. Despite maintaining strong specialized programs like Spanish Dual Language Immersion, the district’s reliance on upcoming bond measures and restrictive transfer policies underscores a fragile organizational health that is struggling to balance specialized successes against systemic financial and academic decline.
Schools
Mount Pleasant Elementary School District is currently in a distressed state, characterized by a stark disparity in school performance and systemic operational challenges. While the district maintains strong community ties and successfully offers specialized tracks like Dual Language Immersion, the ground truth metrics reveal a portfolio where most schools are underperforming, including a 1/10 rating for its namesake elementary. Sustained enrollment declines and budget deficits in a high-cost area threaten the long-term viability of extracurricular programs, while the slow pace of facility upgrades despite bond funding indicates administrative or regulatory bottlenecks that hinder institutional recovery.
Schools
School Insights for East San Jose
Below average outcomes; significant attendance and academic challenges.
School Insights
See what's really behind every school rating near East San Jose
- Individual school ratings — each school's own score with outcome context, not just a district average
- Enrollment & class size data — student-to-teacher ratio and how it compares to the state average
- Full demographics breakdown — ethnicity and gender composition for every school in the enrollment zone
- Every school in the district — all schools within the enrollment boundary ranked by rating, not just the closest one
- Grade levels & benchmarks — elementary through high school, with below/above state-average flags
No credit card required