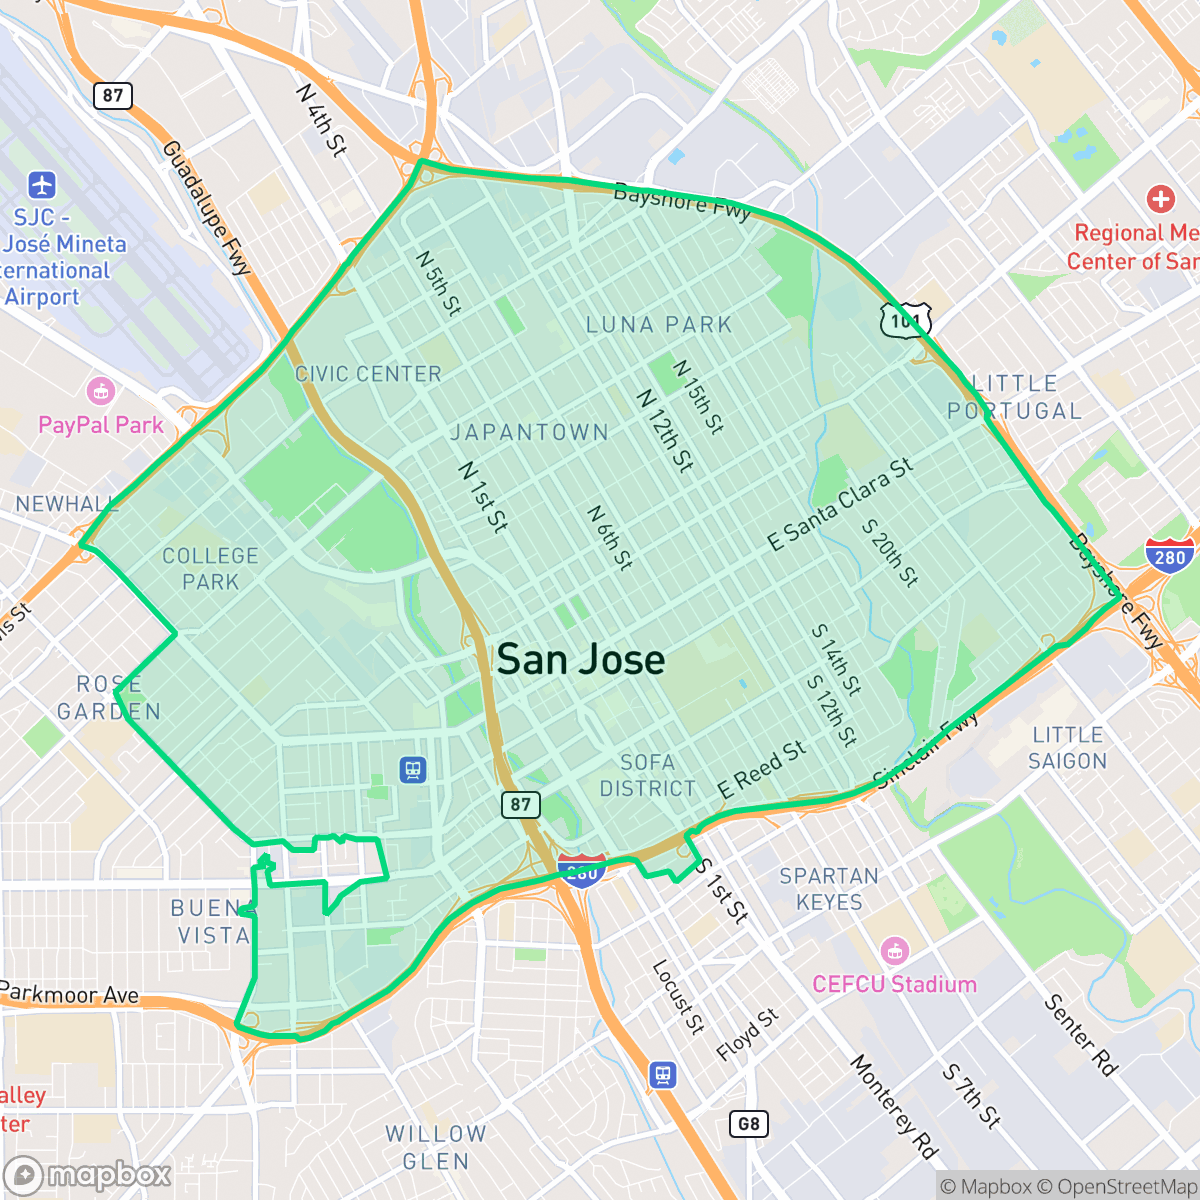
Downtown, San Jose
Updated June 22, 2026 · 77,497 residents
Downtown San Jose serves as a dense, highly walkable urban core defined by its mix of historic architecture and modern civic amenities. While the area offers a vibrant atmosphere with easy access to dining and cultural sites, residents should expect frequent noise from nearby rail and freeway traffic along with limited personal privacy due to high-density housing.
Key Highlights
About Downtown
Downtown San Jose, established at its current site in 1797, served as the original Pueblo de San José de Guadalupe and California's first state capital from 1850 to 1851. The neighborhood is defined by a diverse architectural legacy ranging from the 1797 Peralta Adobe—the city's oldest structure—to 19th-century Italianate and Romanesque Revival buildings, and 1930s Art Deco landmarks like the Hotel De Anza. Historically the commercial heart of the agricultural Santa Clara Valley, the area underwent significant urban renewal in the late 20th century to revitalize its core. Today, sites like the Cathedral Basilica of St. Joseph, the restored California Theatre, and the historic San Pedro Square preserve the neighborhood's evolution from a colonial outpost into a modern civic and cultural center.
The neighborhood is characterized by a dense grid of streets that makes navigating on foot convenient. It serves as a primary hub for local dining and cultural activities, offering a lively pace of life that stands out within the broader city. The landscape is dominated by high-rise buildings and significant infrastructure, creating a concentrated urban environment that supports a diverse mix of young professionals and long-term residents.
Prospective residents should be aware of certain trade-offs, including elevated noise levels from nearby transportation corridors and a higher susceptibility to flooding. The area features limited green space and tightly packed residential units, which may impact personal privacy. It is best suited for individuals who prioritize proximity to urban amenities and high walkability over quiet, expansive residential settings.
Neighborhood Scores Across 15 Qualities
Closely packed buildings and shared-wall multi-unit complexes result in less separation between neighbors than the San Jose average. According to iHuus data, many residential structures are situated very near one another with minimal setbacks.
A dense grid of sidewalks and frequent crosswalks makes navigating the area on foot very easy, though major freeway infrastructure can occasionally disrupt the continuity of the network. This level of walkability is nearly identical to the broader San Jose area.
The landscape consists of a dense mix of apartment complexes, commercial buildings, and standard tract housing. According to iHuus data, the visual variety and greenery are slightly below the San Jose average.
Public park access and green sidewalk verges are somewhat sparse, making this area less dog-friendly than the San Jose average. While some residents can utilize central athletic fields and wooded creek corridors, much of the greenery is restricted to private yards or narrow, paved urban strips.
Dense urban infrastructure and high-rise buildings characterize this area, providing a more concentrated urban feel than the San Jose average. Residents will experience a landscape dominated by significant grey infrastructure and high building coverage alongside pockets of residential density.
Dynamic urban energy and a diverse array of dining options make this area more active than the city average. While some blocks offer high-density, high-energy atmosphere near museums and cafes, other sections provide a quieter, suburban rhythm with scattered local amenities.
Frequent noise from nearby railroad tracks and heavy freeway traffic characterizes this area. Acoustic comfort is notably lower than the San Jose average, according to iHuus data.
Air quality in this area presents a mix of acceptable and unhealthy days, appearing slightly lower than the San Jose average. Sensitive groups should monitor local conditions during periods of occasional concern, according to iHuus data.
Proximity to active rail corridors, large warehouses, and major freeway interchanges can introduce significant noise and heavy vehicle traffic. While the area contains some logistics hubs, it lacks the heavy industrial density found elsewhere in the city according to iHuus data.
Health insurance accessibility is notably lower than the San Jose average. According to iHuus data, a smaller portion of the resident population possesses active coverage compared to the rest of the city.
Voting patterns and census indicators show a predominantly liberal leaning that is even more pronounced than the San Jose average, according to iHuus data.
Residents live alongside a balanced distribution of young professionals, families, and seniors. This demographic spread is slightly lower than the San Jose average, according to iHuus data.
Elevated flood hazards and potential wave action make this area more susceptible to flooding than most of San Jose. Residents should anticipate higher or potentially prohibitive flood insurance costs according to iHuus data.
Block-Level Insights for Downtown

iHuus Neighborhood Intelligence Insights
Get block-level neighborhood insights for Downtown
- Street-level scores — see how individual blocks compare, not just neighborhood averages
- Micro-zone boundaries — identify quiet pockets, flood boundaries, and walkable clusters before you visit
- 15 dimensions in full — walkability, noise, air quality, school quality, insurance coverage, population age profile, urban/rural index, and more
- Boundary risk alerts — know if your address sits near a block boundary where scores drop, the kind of detail no listing will ever mention
- School insights — individual school ratings and insights, not just district-level data
- Compare before you commit — side-by-side data across neighborhoods, down to block precision
No credit card required
Compare with Any Neighborhood
| Dimension | Downtown | Almaden Valley |
|---|---|---|
| 🚶 Walkabilityavg 9.17 | ||
| 🔊 Acoustic Comfortavg 3.12 | ||
| 🤫 Privacy Indexavg 4.96 | ||
| 🎨 Visual Appealavg 6.7 | ||
| 🐕 Dog Friendlinessavg 6.94 | ||
| 🗺️ Urban-Rural Indexavg 6.64 | ||
| ✨ Neighborhood Vibeavg 4.74 | ||
| 🏥 Health Insurance Coverageavg 8.07 | ||
| 🌿 Air Qualityavg 6.07 | ||
| 🏭 Industrial Proximityavg 8.85 | ||
| 🌊 Flood Safetyavg 1.56 | ||
| 🗳️ Ideological Leanavg 9.4 | ||
| 👥 Population Age Profileavg 4.88 | ||
| 🔥 Fire Safetyavg 0.17 | ||
| 🏫 School Quality |
Downtown Rankings
School Districts Serving Downtown
Campbell Union High School District is a highly stable and academically robust organization, characterized by a portfolio of top-tier 'terminal' high schools that consistently outperform state benchmarks. The district demonstrates strong operational health through successful bond-funded modernizations, the comprehensive expansion of student wellness centers, and a clear commitment to specialized pathways like IB and STEM. Although it faces regional challenges regarding teacher retention and high academic stress levels, the district maintains high community trust and a 'Solid' rating due to its academic consistency and proactive leadership.
Schools
Campbell Union Elementary School District is a stable but bifurcated organization characterized by high-performing flagship schools and significant academic underperformance in its lower-tier campuses. While the district maintains strong community financial support through the Measure Z bond, it is currently navigating a period of internal friction focused on administrative spending and fiscal transparency. Academically, CUSD outperforms state averages in core proficiencies, yet it remains shadowed by a 60-point proficiency gap between its top and bottom schools. The district is structurally sound but faces transition challenges as it attempts to balance executive costs with classroom needs and address persistent socioeconomic disparities across its diverse student body.
Schools
East Side Union High School District is a large, diverse system characterized by a sharp academic divide and looming fiscal pressures. While flagship campuses like Evergreen Valley and Piedmont Hills offer world-class STEM and college-prep environments, the district's overall health is hampered by declining enrollment, budgetary shortfalls, and significant performance disparities across its sixteen high schools. Leadership is taking proactive steps toward staff retention and facility modernization through bond measures, but chronic absenteeism and a widening 'two-tiered' resource gap between neighborhood schools remain critical operational challenges.
Schools
Orchard Elementary School District functions as a stable, single-site K-8 entity characterized by a strong sense of community and proactive fiscal management. While academic performance currently sits at a moderate level (5/10), the district shows positive momentum through successful facility modernizations, low staff turnover, and rising literacy scores. The organization effectively leverages its small size to provide individualized attention and has maintained community trust as evidenced by successful bond utilization and positive local sentiment. It remains a 'Mixed/Transition' district primarily because its small scale limits the breadth of secondary-level electives and its math performance has yet to reach elite benchmarks.
Schools
San Jose Unified is a 'Mixed/Transition' district defined by a significant performance gap between its prestigious southern campuses and its struggling alternative and neighborhood schools. While the district maintains strong English and Math proficiency levels compared to state averages and boasts highly sought-after specialized programs like IB and Spanish Immersion, it faces looming fiscal deficits as pandemic relief funds expire. Recent operational stability is offset by community concerns regarding teacher retention in a high-cost environment and the persistent 'good school vs. bad school' divide. The district remains a solid choice for families in specific high-performing feeder zones but faces systemic challenges in ensuring equity and long-term financial health.
Schools
Alum Rock Union Elementary School District is a distressed organization currently undergoing a painful consolidation to avoid a state takeover. With a $20 million budget shortfall and a dramatic loss of over half its student population since 2000, the district has been forced to close six schools and merge others, sparking significant community backlash and student attrition to neighboring districts. Academic performance is critically low across the board, with many schools receiving the lowest possible ratings and proficiency levels remaining well below state averages. Although recent fiscal measures have led to a bond rating upgrade, the district remains under high-intensity scrutiny following an extraordinary audit into potential financial fraud and ongoing administrative instability.
Schools
Franklin-McKinley Elementary School District is currently in a state of operational distress, characterized by a staggering $23 million budget deficit and a 40% decline in student enrollment since 2011. While the district boasts a few high-performing institutions like College Connection Academy, the broader portfolio suffers from significant academic underperformance, with the majority of schools ranking in the bottom half of state proficiency metrics. Fiscal instability has led to contentious school consolidation plans and administrative friction regarding transparency and parental rights. Despite maintaining strong specialized programs like Spanish Dual Language Immersion, the district’s reliance on upcoming bond measures and restrictive transfer policies underscores a fragile organizational health that is struggling to balance specialized successes against systemic financial and academic decline.
Schools
School Insights for Downtown
Below average outcomes; significant attendance and academic challenges.
School Insights
See what's really behind every school rating near Downtown
- Individual school ratings — each school's own score with outcome context, not just a district average
- Enrollment & class size data — student-to-teacher ratio and how it compares to the state average
- Full demographics breakdown — ethnicity and gender composition for every school in the enrollment zone
- Every school in the district — all schools within the enrollment boundary ranked by rating, not just the closest one
- Grade levels & benchmarks — elementary through high school, with below/above state-average flags
No credit card required