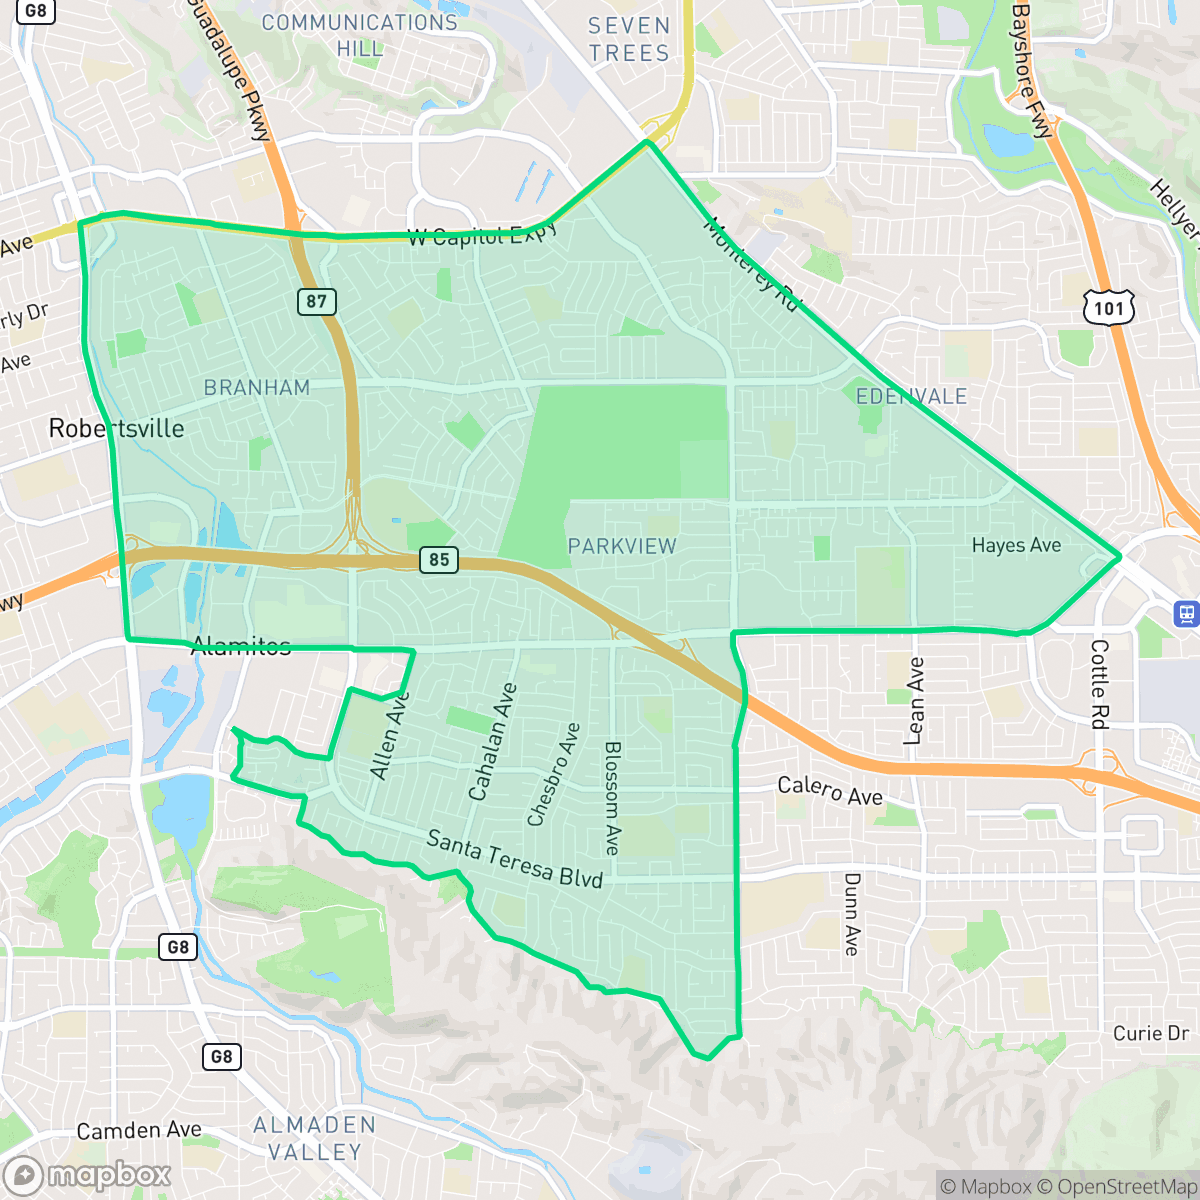
Blossom Valley, San Jose
Updated June 22, 2026 · 67,971 residents
Blossom Valley is a well-manicured suburban community in South San Jose known for its extensive sidewalk networks and access to local parks. Residents enjoy a balanced lifestyle with proximity to retail hubs like Westfield Oakridge, though the area experiences notable noise from nearby transit and traffic corridors.
Key Highlights
About Blossom Valley
Blossom Valley, located in South San Jose, takes its name from the extensive fruit orchards that dominated the landscape during the 1940s. Following the decline of this agrarian era, the neighborhood underwent significant transformation in the 1960s and 1970s as it was developed into a residential community. The area grew in prominence partly due to its proximity to the Blossom Valley IBM research facility, which served as a major regional employer during the rise of Silicon Valley. Today, the neighborhood is characterized by its suburban feel, proximity to the Santa Teresa foothills, and landmarks such as the Westfield Oakridge Mall. It remains a distinct residential hub defined by its transition from orchard land to a modern, family-oriented community with a strong neighborhood association and access to transit corridors like the VTA light rail.
The neighborhood features a mix of single-family homes and apartment complexes, creating a suburban landscape that emphasizes pedestrian accessibility. With well-maintained properties and frequent private backyard pools, the area offers a visually appealing environment. The presence of expansive trail systems and public green spaces makes it a practical choice for dog owners, while its minimal industrial footprint contributes to a cleaner residential atmosphere.
Prospective residents should account for specific environmental and infrastructure trade-offs. The area faces elevated risks regarding flood and fire hazards, and the proximity to major freeways and railroad tracks results in higher noise levels for many households. While the local school districts offer specialized programs, they are currently navigating significant fiscal and enrollment challenges. The neighborhood is best suited for those who prioritize suburban space and walkability while remaining prepared for the realities of living in a high-risk environmental zone.
Neighborhood Scores Across 15 Qualities
Housing density varies across the area, ranging from shared-wall apartment complexes and mobile home parks to detached suburban houses. According to iHuus data, the level of privacy and separation between neighbors is roughly comparable to the San Jose average.
Extensive sidewalk networks and well-marked crossings throughout the residential streets make navigating the area on foot easy and safe. While the neighborhood remains slightly below the San Jose average for walkability, the presence of low-traffic cul-de-sacs and connected paths provides a reliable environment for strollers and pedestrians.
Large homes with well-maintained landscaping and frequent private backyard pools characterize this area, which sits slightly above the San Jose average for visual appeal. Residents will notice substantial multi-car driveways and many well-kept properties throughout the neighborhood.
Extensive trail systems, large public parks, and wide grassy verges between sidewalks and roads provide ample space for pets. According to iHuus data, these connected green spaces and continuous paths offer slightly better accessibility for dogs than the San Jose average.
Residential layouts feature a dense mix of single-family homes and apartment complexes with integrated green spaces. This landscape is slightly more open than the typical San Jose urban environment.
A mix of quiet residential pockets and active commercial strips provides a liveliness that is slightly above the city average. While some blocks offer diverse dining and walkable amenities, other areas remain car-dependent and more serene.
Frequent traffic and transit noise from nearby freeways and railroad tracks characterize this area. According to iHuus data, acoustic comfort is lower than the San Jose average.
Air quality levels fluctuate between acceptable and unhealthy, presenting occasional concerns for sensitive groups. According to iHuus data, the quality in this area is roughly in line with the San Jose average.
Land use is primarily residential and light commercial, with no heavy industrial hazards or large-scale warehouses detected. According to iHuus data, this area maintains a slightly cleaner profile regarding industrial proximity than the San Jose average.
Health insurance access is widespread among residents, sitting above the San Jose average according to iHuus data.
Voting patterns and census indicators reflect a strong liberal leaning that is consistent with the average across San Jose. According to iHuus data, the political landscape here mirrors the broader city trend.
Residents live alongside a diverse range of age groups, including young professionals, families, and seniors. This demographic distribution is consistent with the broader San Jose area.
Flood risk in this area is notably higher than the San Jose average. Residents should prepare for elevated or potentially prohibitive flood insurance costs due to the specific hazards identified in iHuus data.
Severe fire risks exist throughout this area, which is slightly higher than the San Jose average according to iHuus data.
Block-Level Insights for Blossom Valley

iHuus Neighborhood Intelligence Insights
Get block-level neighborhood insights for Blossom Valley
- Street-level scores — see how individual blocks compare, not just neighborhood averages
- Micro-zone boundaries — identify quiet pockets, flood boundaries, and walkable clusters before you visit
- 15 dimensions in full — walkability, noise, air quality, school quality, insurance coverage, population age profile, urban/rural index, and more
- Boundary risk alerts — know if your address sits near a block boundary where scores drop, the kind of detail no listing will ever mention
- School insights — individual school ratings and insights, not just district-level data
- Compare before you commit — side-by-side data across neighborhoods, down to block precision
No credit card required
Compare with Any Neighborhood
| Dimension | Blossom Valley | Almaden Valley |
|---|---|---|
| 🚶 Walkabilityavg 9.17 | ||
| 🔊 Acoustic Comfortavg 3.12 | ||
| 🤫 Privacy Indexavg 4.96 | ||
| 🎨 Visual Appealavg 6.7 | ||
| 🐕 Dog Friendlinessavg 6.94 | ||
| 🗺️ Urban-Rural Indexavg 6.64 | ||
| ✨ Neighborhood Vibeavg 4.74 | ||
| 🏥 Health Insurance Coverageavg 8.07 | ||
| 🌿 Air Qualityavg 6.07 | ||
| 🏭 Industrial Proximityavg 8.85 | ||
| 🌊 Flood Safetyavg 1.56 | ||
| 🗳️ Ideological Leanavg 9.4 | ||
| 👥 Population Age Profileavg 4.88 | ||
| 🔥 Fire Safetyavg 0.17 | ||
| 🏫 School Quality |
Blossom Valley Rankings
School Districts Serving Blossom Valley
East Side Union High School District is a large, diverse system characterized by a sharp academic divide and looming fiscal pressures. While flagship campuses like Evergreen Valley and Piedmont Hills offer world-class STEM and college-prep environments, the district's overall health is hampered by declining enrollment, budgetary shortfalls, and significant performance disparities across its sixteen high schools. Leadership is taking proactive steps toward staff retention and facility modernization through bond measures, but chronic absenteeism and a widening 'two-tiered' resource gap between neighborhood schools remain critical operational challenges.
Schools
Oak Grove Elementary School District is currently in a state of 'Mixed/Transition' stability, marked by a sharp divide between its high-performing academic programs and a looming fiscal crisis. While the district maintains several prestigious 10/10 campuses and successful specialized programs that enjoy strong community support, it is simultaneously grappling with declining enrollment, teacher retention issues due to regional inflation, and the necessity of unpopular school consolidations. The academic portfolio is highly inconsistent, ranging from top-tier success to 1/10 performance levels, and while state-funded 'Community School' initiatives show promise for social-emotional health, the district's operational health is threatened by a significant budget deficit and aging infrastructure.
Schools
San Jose Unified is a 'Mixed/Transition' district defined by a significant performance gap between its prestigious southern campuses and its struggling alternative and neighborhood schools. While the district maintains strong English and Math proficiency levels compared to state averages and boasts highly sought-after specialized programs like IB and Spanish Immersion, it faces looming fiscal deficits as pandemic relief funds expire. Recent operational stability is offset by community concerns regarding teacher retention in a high-cost environment and the persistent 'good school vs. bad school' divide. The district remains a solid choice for families in specific high-performing feeder zones but faces systemic challenges in ensuring equity and long-term financial health.
Schools
Franklin-McKinley Elementary School District is currently in a state of operational distress, characterized by a staggering $23 million budget deficit and a 40% decline in student enrollment since 2011. While the district boasts a few high-performing institutions like College Connection Academy, the broader portfolio suffers from significant academic underperformance, with the majority of schools ranking in the bottom half of state proficiency metrics. Fiscal instability has led to contentious school consolidation plans and administrative friction regarding transparency and parental rights. Despite maintaining strong specialized programs like Spanish Dual Language Immersion, the district’s reliance on upcoming bond measures and restrictive transfer policies underscores a fragile organizational health that is struggling to balance specialized successes against systemic financial and academic decline.
Schools
School Insights for Blossom Valley
Below average outcomes; significant attendance and academic challenges.
School Insights
See what's really behind every school rating near Blossom Valley
- Individual school ratings — each school's own score with outcome context, not just a district average
- Enrollment & class size data — student-to-teacher ratio and how it compares to the state average
- Full demographics breakdown — ethnicity and gender composition for every school in the enrollment zone
- Every school in the district — all schools within the enrollment boundary ranked by rating, not just the closest one
- Grade levels & benchmarks — elementary through high school, with below/above state-average flags
No credit card required