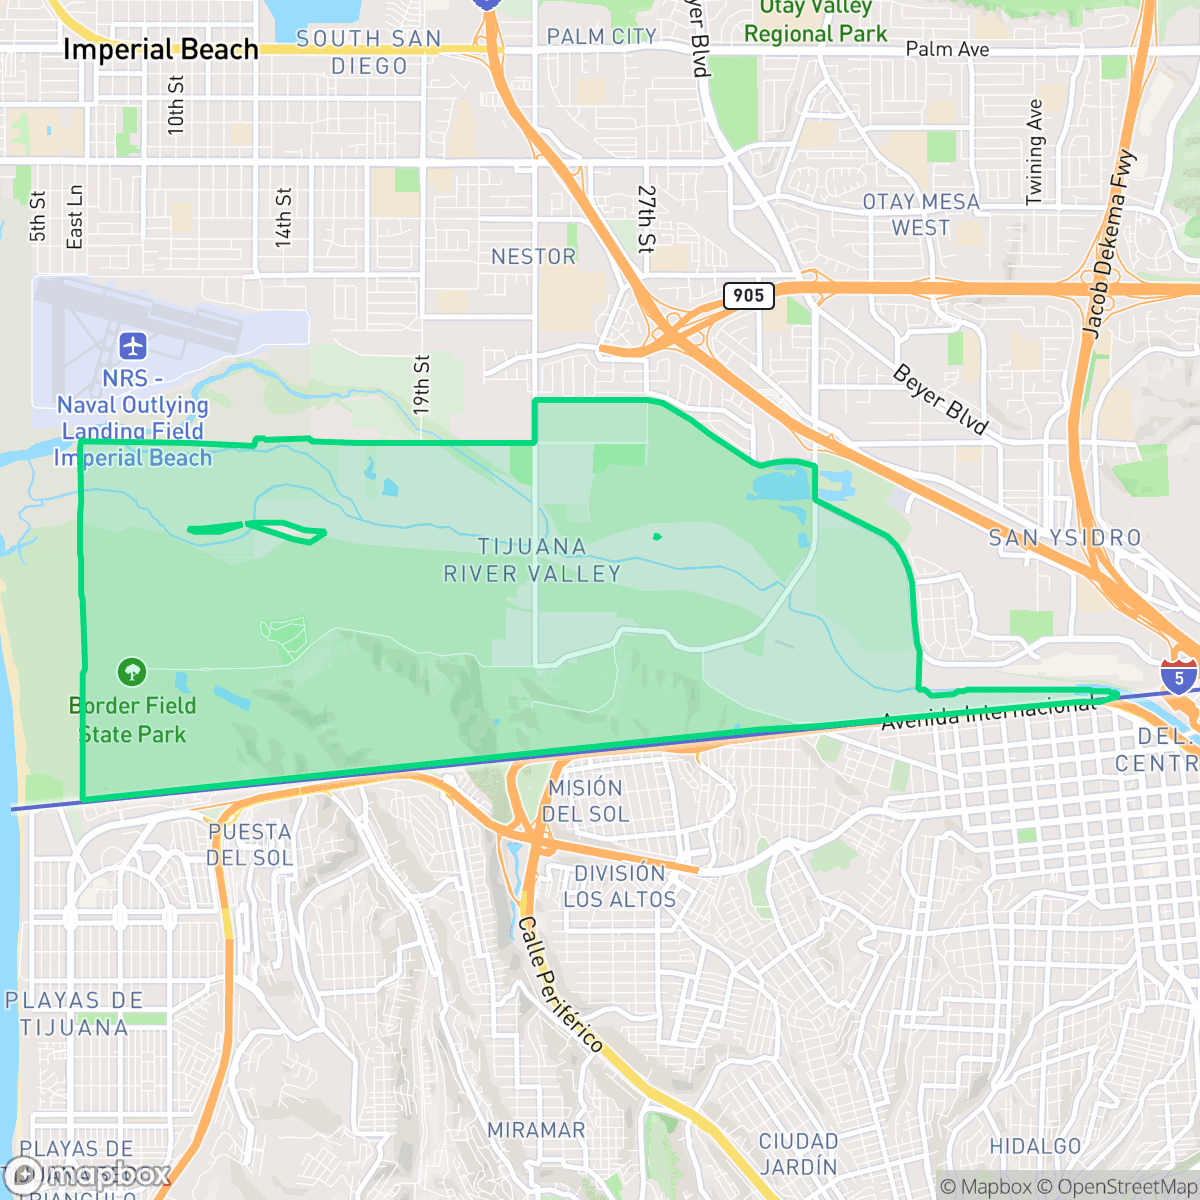
Tijuana River Valley, San Diego
Updated June 22, 2026 · 3,943 residents
The Tijuana River Valley is a vast, rural landscape defined by expansive open spaces, dirt trails, and a strong equestrian culture. While it offers high levels of privacy and exceptional dog-friendly environments, the area remains largely undeveloped with limited commercial activity and significant environmental risks.
Key Highlights
About Tijuana River Valley
Originally inhabited by the Kumeyaay people, who established the village of Melijo near Smuggler’s Gulch, the Tijuana River Valley in southern San Diego later became part of the Mexican land grant Rancho Melijo. In the late 1860s, pioneer farmers settled the fertile floodplain, establishing an agricultural community known as Monument City. Annexed by the City of San Diego in 1957, this rural neighborhood has largely resisted heavy urbanization. Today, it maintains a distinct rustic, equestrian character defined by miles of dirt trails, horse stables, and agricultural plots like the Tijuana River Community Garden. The valley is also home to ecologically vital protected areas, including the Tijuana River National Estuarine Research Reserve and Border Field State Park, though it faces ongoing modern challenges from transboundary flooding and pollution.
The neighborhood is a remote, low-density region dominated by coastal sage scrub, agricultural plots, and natural riverbed features. Unlike the surrounding urban sprawl of San Diego, the area maintains a quiet, rural atmosphere characterized by its proximity to protected ecological zones like the Tijuana River National Estuarine Research Reserve. Residents and visitors primarily engage with the outdoors, utilizing the extensive network of dirt paths that make the region a premier destination for equestrian activities and dog owners.
The area presents distinct livability challenges, including high industrial proximity and significant environmental hazards such as flood and fire risks. Commercial infrastructure is minimal, requiring residents to travel to neighboring communities for daily essentials. Given the lack of urban amenities and the presence of complex infrastructure like wastewater treatment facilities, the area is best suited for those prioritizing seclusion, natural surroundings, and outdoor recreation over proximity to city services.
Neighborhood Scores Across 15 Qualities
Residential density fluctuates across the area, with some clusters featuring closely situated buildings and shared walls while other sections offer more typical suburban buffers. This level of privacy is slightly lower than the San Diego average according to iHuus data.
Pedestrian access varies significantly across the area, as some residential sections feature continuous sidewalks while others are fragmented by major freeways and unpaved zones. According to iHuus data, the ease of walking on foot is slightly below the city average due to these disconnected pockets and large undeveloped gaps.
Visual variety is limited by standard tract housing and dense, small-lot developments. This area offers a more utilitarian landscape than the San Diego average, characterized by uniform rooflines and a lack of large private estates or luxury amenities.
Extensive natural trails, wetlands, and central parklands provide much more space for pets than the typical San Diego neighborhood. According to iHuus data, the presence of wide grassy verges and connected green spaces offers excellent opportunities for exercise away from traffic.
Large tracts of open natural space, riparian corridors, and coastal sage scrub define the landscape, making the area more rural than the San Diego average. Residential pockets vary between dense suburban grids and low-density areas characterized by vast fields and minimal building density.
Low business density and vast open spaces create a tranquil, rural atmosphere; however, the area lacks a central commercial hub and is less active than the San Diego average. Most daily needs require driving due to the sparse distribution of local shops and dining options.
Frequent noise from nearby railroad tracks and heavy freeway traffic is a persistent feature of this area. According to iHuus data, acoustic comfort levels here are roughly in line with the San Diego average.
Air quality fluctuates between acceptable and unhealthy levels, appearing slightly lower than the San Diego average. Residents in sensitive groups may experience occasional concern on certain days according to iHuus data.
Industrial presence is minimal and mostly limited to light commercial structures; however, some areas near major highways and wastewater treatment facilities may experience increased noise or dust. This level of industrial proximity is slightly higher than the San Diego average according to iHuus data.
Health insurance accessibility is lower in this area compared to the San Diego average, according to iHuus data.
Voting patterns and census indicators reflect a strong liberal leaning that is more pronounced than the San Diego average. According to iHuus data, the area maintains a consistently progressive political landscape.
A balanced mix of young adults, families, and seniors defines the local community. According to iHuus data, the age distribution is slightly more concentrated in certain age brackets compared to the city average.
Flood risk in this area remains difficult to assess because official federal studies for this specific zone are currently incomplete. According to iHuus data, the level of risk is slightly higher than the San Diego average.
Wildfire risk in this area is exceptionally high, representing a significant danger that is slightly more severe than the San Diego average. According to iHuus data, residents must prioritize extreme fire protection measures due to the intense nature of the local hazard.
Block-Level Insights for Tijuana River Valley

iHuus Neighborhood Intelligence Insights
Get block-level neighborhood insights for Tijuana River Valley
- Street-level scores — see how individual blocks compare, not just neighborhood averages
- Micro-zone boundaries — identify quiet pockets, flood boundaries, and walkable clusters before you visit
- 15 dimensions in full — walkability, noise, air quality, school quality, insurance coverage, population age profile, urban/rural index, and more
- Boundary risk alerts — know if your address sits near a block boundary where scores drop, the kind of detail no listing will ever mention
- School insights — individual school ratings and insights, not just district-level data
- Compare before you commit — side-by-side data across neighborhoods, down to block precision
No credit card required
Compare with Any Neighborhood
| Dimension | Tijuana River Valley | Adams North |
|---|---|---|
| 🚶 Walkabilityavg 8.58 | ||
| 🔊 Acoustic Comfortavg 3.33 | ||
| 🤫 Privacy Indexavg 4.87 | ||
| 🎨 Visual Appealavg 6.85 | ||
| 🐕 Dog Friendlinessavg 6.91 | ||
| 🗺️ Urban-Rural Indexavg 6.6 | ||
| ✨ Neighborhood Vibeavg 5.12 | ||
| 🏥 Health Insurance Coverageavg 7.53 | ||
| 🌿 Air Qualityavg 6.36 | ||
| 🏭 Industrial Proximityavg 9.12 | ||
| 🌊 Flood Safetyavg 4.2 | ||
| 🗳️ Ideological Leanavg 8.51 | ||
| 👥 Population Age Profileavg 4.8 | ||
| 🔥 Fire Safetyavg 0.61 | ||
| 🏫 School Quality |
Tijuana River Valley Rankings
School Districts Serving Tijuana River Valley
San Ysidro Elementary School District is currently in a state of transition, moving from historical fiscal distress toward operational stability. While the district celebrates recent improvements in literacy, successful infrastructure bonding, and a move to a healthier financial status, it is characterized by extreme academic disparity where high-performing flagship schools like Ocean View Hills coexist with several campuses rated 1/10. The district serves a high-need border population with dedicated support for English Language Learners and has recently bolstered its security and extracurricular offerings, yet it remains a 'mixed' entity due to the significant achievement gap and systemic math proficiency challenges across its portfolio.
Schools
Sweetwater Union High School District functions as a stable but stratified educational entity, characterized by a significant performance gap between its high-achieving high schools and its struggling middle school feeder patterns. While the district celebrates recent accolades like the 2026 California Distinguished Schools award and maintains strong community trust through facility modernizations and specialized programs like Middle College, its academic core remains mixed with proficiency levels trailing behind state leaders. A legacy of legal settlements and varied facility conditions across its 29 campuses further underscores a 'middle-of-the-road' status, where pockets of excellence are offset by persistent operational and academic challenges in underserved zones.
Schools
South Bay Union School District is currently in a distressed state, characterized by a staggering 40% enrollment drop, chronic structural deficits, and a contentious school consolidation plan involving the closure of multiple campuses through 2032. While the district maintains a few well-regarded programs and utilizes bond funds for facility maintenance at select sites, the overall academic profile is weak, with several schools performing at the 2/10 and 3/10 levels. Severe labor tensions and a potential teacher strike, coupled with the postponement of specialized magnet programs to focus on foundational academic gaps, signal a district struggling to maintain operational and community stability amidst a shrinking tax base.
Schools
School Insights for Tijuana River Valley
Below average outcomes; significant attendance and academic challenges.
School Insights
See what's really behind every school rating near Tijuana River Valley
- Individual school ratings — each school's own score with outcome context, not just a district average
- Enrollment & class size data — student-to-teacher ratio and how it compares to the state average
- Full demographics breakdown — ethnicity and gender composition for every school in the enrollment zone
- Every school in the district — all schools within the enrollment boundary ranked by rating, not just the closest one
- Grade levels & benchmarks — elementary through high school, with below/above state-average flags
No credit card required