Little Italy, San Diego
Updated June 22, 2026 · 2,184 residents
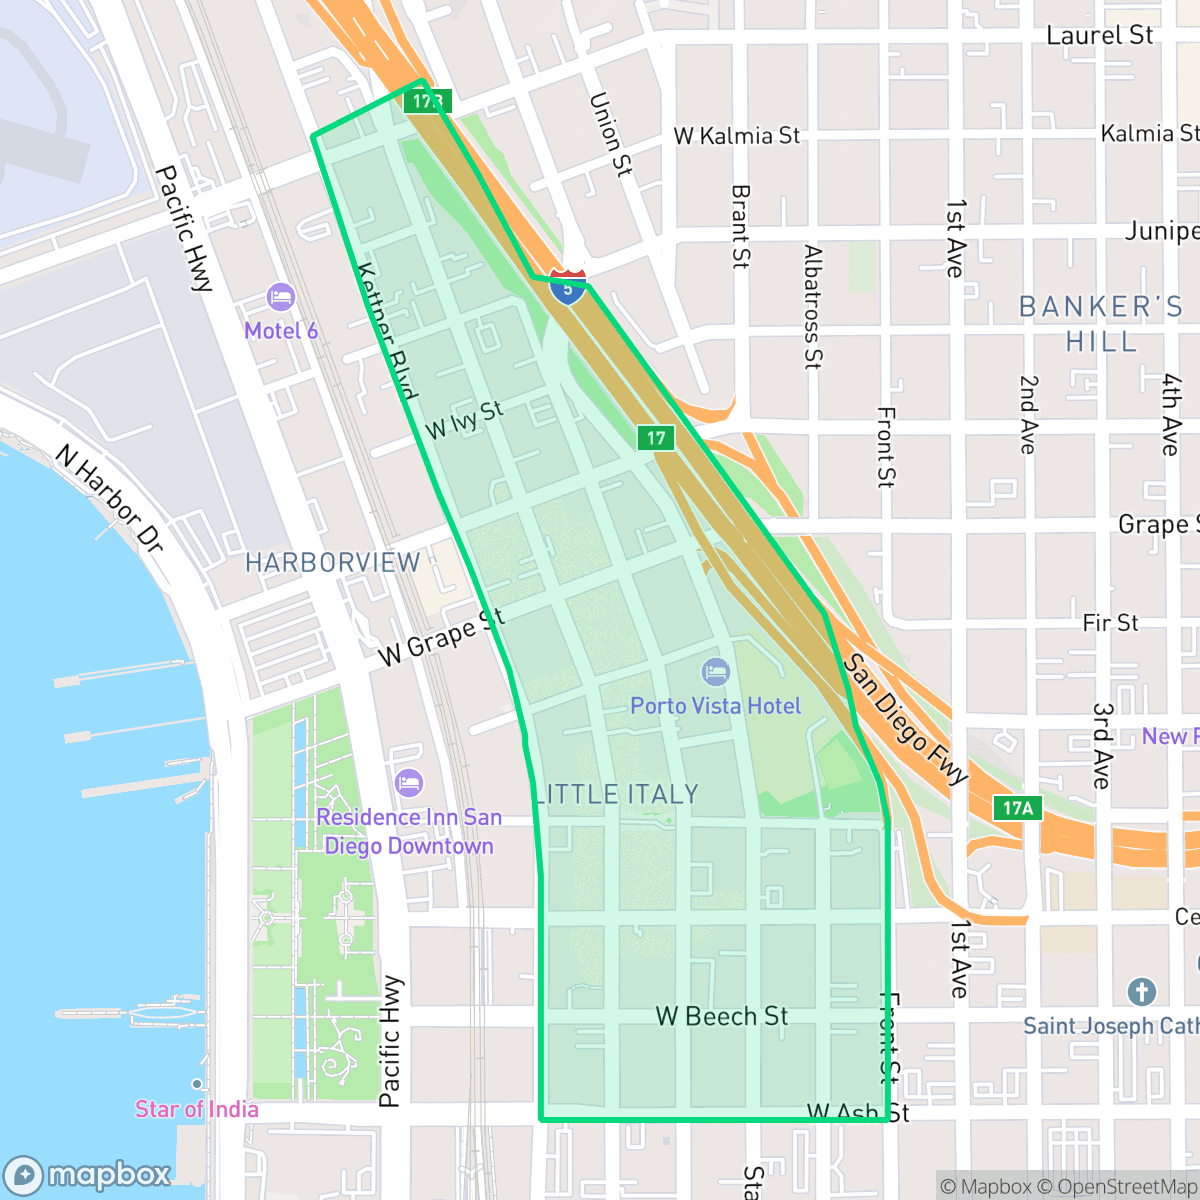
Little Italy is a dense, vibrant urban district known for its concentration of restaurants and cafes along India Street. While the area offers high walkability and a central location, residents experience significant noise from nearby freeway traffic and airport flight paths.
Key Highlights
About Little Italy
San Diego’s Little Italy originated in the early 20th century as a waterfront enclave settled by Italian immigrants, primarily from Genoa and Sicily, who established a thriving tuna fishing industry that once made San Diego the "tuna capital" of the West Coast. At its peak, the neighborhood was home to over 6,000 Italian families. However, the construction of Interstate 5 in the 1970s demolished 35% of the district, initiating a decades-long decline. Revitalization efforts in the 1990s, spearheaded by the Little Italy Association, transformed the area into a vibrant pedestrian-friendly district. Today, India Street serves as its bustling commercial corridor, anchored by landmarks like the 1925 Our Lady of the Rosary Church, the historic San Diego Firehouse Museum, and the Piazza della Famiglia, preserving the neighborhood’s rich cultural heritage.
The area functions as a high-density urban hub characterized by multi-story residential and commercial buildings. Beyond its culinary reputation, the neighborhood features a grid-based street layout that facilitates pedestrian movement, though the surrounding infrastructure includes industrial zones and major transportation arteries. According to iHuus data, the environment is marked by close proximity between structures, resulting in limited residential privacy.
Neighborhood Scores Across 15 Qualities
Buildings are tightly packed with very little separation between structures, resulting in a significantly lower level of privacy than the San Diego average. Many residents live in high-density housing with shared walls or narrow alleys that overlook pedestrian and vehicle traffic.
Wide sidewalks and dedicated waterfront pedestrian zones make most daily errands accessible on foot. According to iHuus data, the neighborhood offers significantly better walkability than the San Diego average due to its consistent grid and frequent crosswalks.
The skyline features a mix of modern high-rises and mid-range apartment blocks with limited private green space. This urban density and lack of yard space result in a visual profile that is slightly below the San Diego city average.
Dense urban development and narrow sidewalks characterize much of the area, though Waterfront Park provides nearby access to large lawns and walking paths. Overall dog-friendly features are below the San Diego average according to iHuus data.
High-rise structures and extensive pavement dominate the landscape, creating a much more built-up environment than the typical San Diego neighborhood. According to iHuus data, residents will find very little unpaved ground or natural greenery amidst the dense mix of commercial and residential blocks.
Constant movement and a dense concentration of dining and retail establishments create a much more active atmosphere than the San Diego average. According to iHuus data, the area functions as an intense urban sector characterized by significant commercial pull and high-rise development.
Frequent aircraft noise from the nearby airport runway makes acoustic comfort significantly lower than the San Diego average. According to iHuus data, this area experiences persistent loud interruptions due to its extreme proximity to flight paths.
Air quality levels fluctuate between acceptable and unhealthy, occasionally posing risks to sensitive groups. According to iHuus data, these conditions are slightly lower than the San Diego city average.
Heavy manufacturing is absent from this area, though proximity to maritime piers and a local gas station may introduce occasional utility odors or transit noise. This neighborhood maintains a slightly higher level of industrial proximity than the San Diego average due to nearby port warehouses.
Health insurance access is significantly lower than the San Diego average, according to iHuus data. This indicates a high proportion of uninsured residents within the neighborhood.
Voting patterns and census indicators show a significantly more liberal political leaning than the San Diego average, according to iHuus data.
A balanced mix of young professionals, families, and older adults characterizes the local demographic. This distribution is largely consistent with the broader San Diego area, according to iHuus data.
Flood risk levels in this area are currently difficult to assess because local federal studies are incomplete. According to iHuus data, the level of risk is roughly in line with the San Diego city average.
Fire hazards are notably higher in this area than the San Diego average, necessitating increased awareness of local mitigation measures. According to iHuus data, residents should account for significant fire safety risks when evaluating properties here.
Block-Level Insights for Little Italy

iHuus Neighborhood Intelligence Insights
Get block-level neighborhood insights for Little Italy
- Street-level scores — see how individual blocks compare, not just neighborhood averages
- Micro-zone boundaries — identify quiet pockets, flood boundaries, and walkable clusters before you visit
- 15 dimensions in full — walkability, noise, air quality, school quality, insurance coverage, population age profile, urban/rural index, and more
- Boundary risk alerts — know if your address sits near a block boundary where scores drop, the kind of detail no listing will ever mention
- School insights — individual school ratings and insights, not just district-level data
- Compare before you commit — side-by-side data across neighborhoods, down to block precision
No credit card required
Compare with Any Neighborhood
| Dimension | Little Italy | Adams North |
|---|---|---|
| 🚶 Walkabilityavg 8.58 | ||
| 🔊 Acoustic Comfortavg 3.33 | ||
| 🤫 Privacy Indexavg 4.87 | ||
| 🎨 Visual Appealavg 6.85 | ||
| 🐕 Dog Friendlinessavg 6.91 | ||
| 🗺️ Urban-Rural Indexavg 6.6 | ||
| ✨ Neighborhood Vibeavg 5.12 | ||
| 🏥 Health Insurance Coverageavg 7.53 | ||
| 🌿 Air Qualityavg 6.36 | ||
| 🏭 Industrial Proximityavg 9.12 | ||
| 🌊 Flood Safetyavg 4.2 | ||
| 🗳️ Ideological Leanavg 8.51 | ||
| 👥 Population Age Profileavg 4.8 | ||
| 🔥 Fire Safetyavg 0.61 | ||
| 🏫 School Quality |
Little Italy Rankings
School Districts Serving Little Italy
San Diego Unified is a district in transition, characterized by a mix of elite-performing clusters and significant pockets of academic distress. While recent gains in literacy, mathematics, and graduation rates—alongside multiple national awards—demonstrate strong educational potential, these successes are clouded by a $47 million budget deficit, declining enrollment, and labor instability resulting in a 2026 teacher strike. The district maintains high community trust in its 'destination' neighborhoods like La Jolla and Scripps Ranch, but significant equity gaps and financial pressures regarding special education funding prevent it from achieving a higher stability rating. It currently operates as a 'Mixed' district where high-quality outcomes are consistent in affluent clusters but systemic operational challenges remain unresolved.
Schools
School Insights for Little Italy
Below average outcomes; significant attendance and academic challenges.
School Insights
See what's really behind every school rating near Little Italy
- Individual school ratings — each school's own score with outcome context, not just a district average
- Enrollment & class size data — student-to-teacher ratio and how it compares to the state average
- Full demographics breakdown — ethnicity and gender composition for every school in the enrollment zone
- Every school in the district — all schools within the enrollment boundary ranked by rating, not just the closest one
- Grade levels & benchmarks — elementary through high school, with below/above state-average flags
No credit card required