South Natomas, Sacramento
Updated · 25,363 residents
South Natomas is a highly walkable community characterized by its suburban layout and proximity to riverfront parks like Discovery Park. While the area benefits from extensive pedestrian infrastructure and dog-friendly green spaces, residents should be aware of consistent noise from road traffic and significant regional flood risks.
Key Highlights
About South Natomas
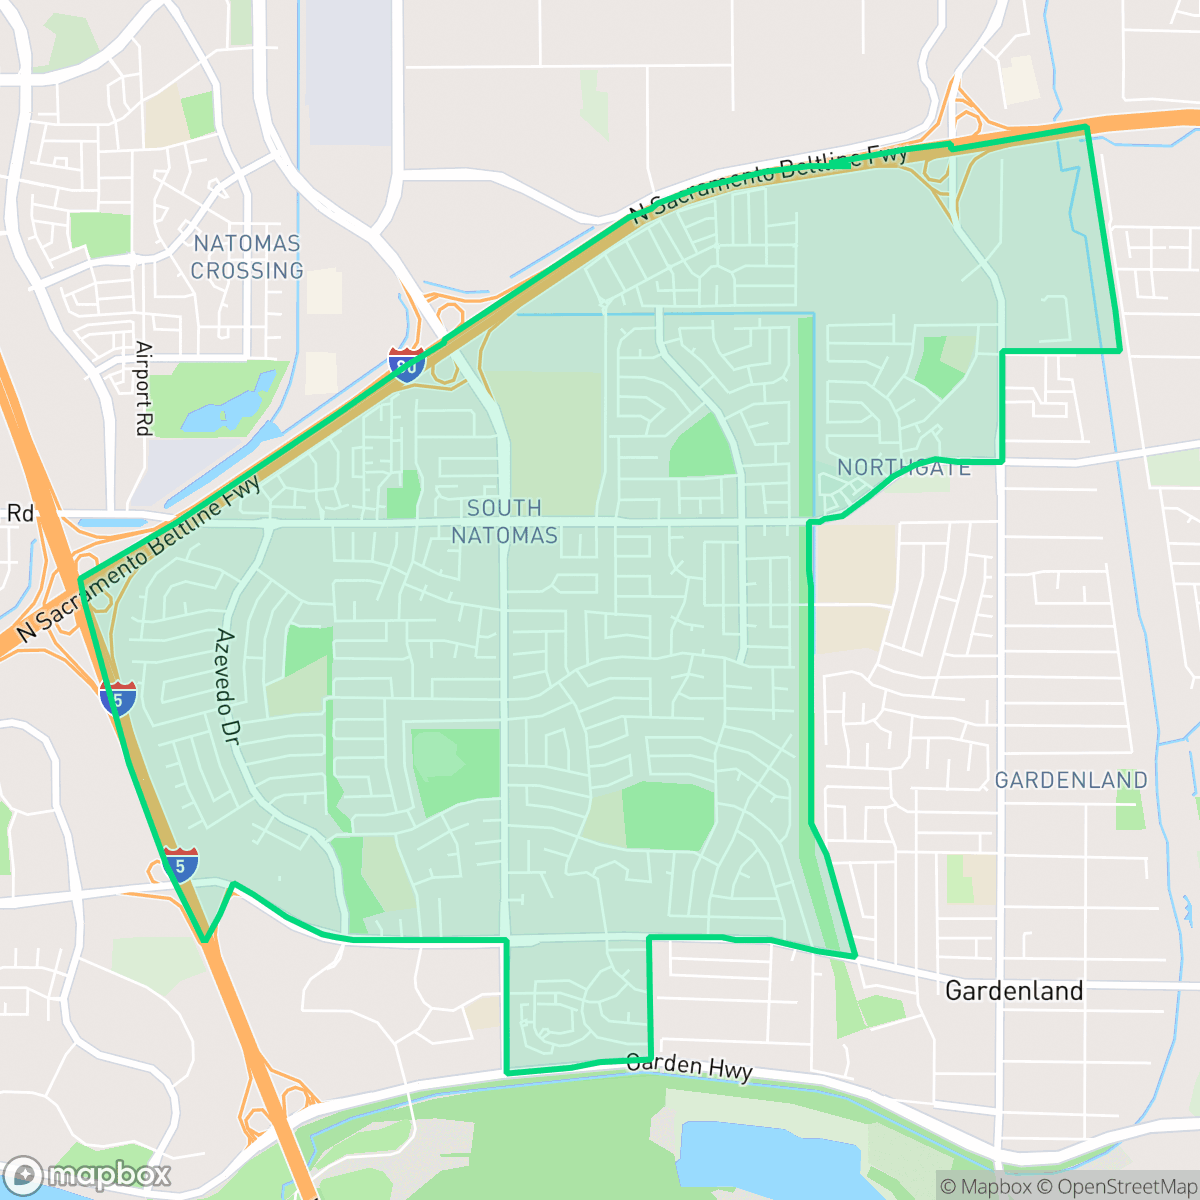
Bounded by the Sacramento and American rivers, South Natomas in Sacramento, CA, transitioned from a historical floodplain into a suburban hub after its annexation in the 1960s. The neighborhood developed primarily as residential subdivisions between 1950 and 1980. The construction of Interstate 5 significantly shaped the area, leading to a 1982 community plan amendment that allowed for 2.4 million square feet of office parks along the freeway corridor. This community plan was a central focus of former Sacramento Mayor Heather Fargo's early political career. Today, South Natomas is characterized by its diverse community spaces, including the Natomas Rose Garden, the South Natomas Community Center, and the International Garden of Many Colors—a community garden where recent immigrants practice urban agriculture. It also features prominent riverfront open spaces like Discovery Park and Camp Pollock.
The neighborhood functions as a dense suburban environment that prioritizes pedestrian connectivity, offering a comprehensive network of sidewalks and clear paths that make local amenities easily accessible. Its landscape is defined by standard residential tract housing and a strong emphasis on outdoor recreation, with multiple parks and green corridors providing ample room for residents and their pets. The area maintains a quiet, residential atmosphere that is largely free from industrial activity, allowing for a consistent, if suburban, living experience that relies heavily on its established grid and community-focused infrastructure.
Prospective residents should weigh these benefits against several notable trade-offs. The acoustic environment is often impacted by road traffic, which remains the primary source of noise in the area. Furthermore, the neighborhood faces significant challenges regarding flood safety, and prospective buyers should review local hazard disclosures carefully. The educational landscape is characterized by a high degree of variance in school performance across multiple districts, reflecting a broader regional trend of academic inconsistency. This location is best suited for those who prioritize walkability and access to riverfront open spaces over proximity to high-performing school zones or absolute acoustic tranquility.
Neighborhood Scores Across 15 Qualities
Residential density varies across the area, featuring both closely spaced suburban subdivisions and higher density apartment structures. According to iHuus data, the level of privacy and buffer between neighbors is slightly higher than the Sacramento average.
Continuous sidewalks on both sides of streets and safe, low-traffic residential grids make most errands easy to complete on foot. According to iHuus data, the pedestrian infrastructure and network of clear crosswalks are notably more comprehensive than the Sacramento average.
Uniform rooflines and small yards characterize this residential area, which features a visual appeal roughly in line with the Sacramento average. Streetscapes consist primarily of middle-class tract housing and apartment complexes with occasional private backyard pools.
Abundant parks, athletic fields, and wide green buffers along sidewalks provide ample space for walking dogs. This level of accessibility to open green space is above the Sacramento average, according to iHuus data.
Residential tracts blend with large-scale industrial warehouses and undeveloped land. This landscape matches the city average for the balance of urban and rural elements.
Suburban streets and green spaces provide a steady, calm pace of life with a variety of local dining and essential services accessible via short walks. This level of activity is slightly below the Sacramento average due to the presence of quieter, industrial-leaning pockets and highway-adjacent areas.
Frequent sounds from nearby freeways, railroad tracks, and flight paths contribute to a level of acoustic disturbance that is notably higher than the Sacramento average. According to iHuus data, residents may experience significant ambient noise throughout the day and night.
Air quality levels fluctuate between acceptable and unhealthy conditions, staying roughly in line with the Sacramento average. Sensitive groups should remain aware of occasional days with increased concern, according to iHuus data.
Industrial activity and heavy warehouse presence are minimal here, making the area noticeably more residential than the Sacramento average. According to iHuus data, the landscape consists mainly of residential, educational, and recreational zones with few visible industrial hazards.
Health insurance coverage among residents is lower than the Sacramento average, according to iHuus data. This indicates a higher proportion of uninsured individuals compared to many other parts of the city.
Voting patterns and census indicators reflect a predominantly liberal political leaning, which is slightly more pronounced than the average seen across Sacramento.
A balanced blend of young adults, families, and older residents defines the local demographic. This age distribution is slightly lower than the Sacramento average according to iHuus data.
Significant flood risk exists in this area, which is much higher than the Sacramento average. Residents should anticipate much higher insurance premiums and potential property vulnerabilities according to iHuus data.
Address-Level Insights for South Natomas


iHuus Neighborhood Intelligence Insights
Get address-level neighborhood insights for South Natomas
- Street-level scores — see how individual blocks compare, not just neighborhood averages
- Micro-zone boundaries — identify quiet pockets, flood boundaries, and walkable clusters before you visit
- 15 dimensions in full — walkability, noise, air quality, school quality, insurance coverage, population age profile, urban/rural index, and more
- Boundary risk alerts — know if your address sits near a block boundary where scores drop, the kind of detail no listing will ever mention
- School insights — individual school ratings and insights, not just district-level data
- Compare before you commit — side-by-side data across neighborhoods, down to block precision
No credit card required
Compare with Any Neighborhood
| Dimension | South Natomas | Airport |
|---|---|---|
| 🚶 Walkabilityavg 8.5 | ||
| 🔊 Acoustic Comfortavg 3.22 | ||
| 🤫 Privacy Indexavg 5.34 | ||
| 🎨 Visual Appealavg 6.3 | ||
| 🐕 Dog Friendlinessavg 6.98 | ||
| 🗺️ Urban-Rural Indexavg 6.57 | ||
| ✨ Neighborhood Vibeavg 4.66 | ||
| 🏥 Health Insurance Coverageavg 7.4 | ||
| 🌿 Air Qualityavg 6.12 | ||
| 🏭 Industrial Proximityavg 8.32 | ||
| 🌊 Flood Safetyavg 6.04 | ||
| 🗳️ Ideological Leanavg 9.49 | ||
| 👥 Population Age Profileavg 4.75 | ||
| 🔥 Fire Safetyavg 0 | ||
| 🏫 School Quality |
South Natomas Rankings
School Districts Serving South Natomas
School Insights for South Natomas
Below average outcomes; significant attendance and academic challenges.
School Insights
See what's really behind every school rating near South Natomas
- Individual school ratings — each school's own score with outcome context, not just a district average
- Enrollment & class size data — student-to-teacher ratio and how it compares to the state average
- Full demographics breakdown — ethnicity and gender composition for every school in the enrollment zone
- Every school in the district — all schools within the enrollment boundary ranked by rating, not just the closest one
- Grade levels & benchmarks — elementary through high school, with below/above state-average flags
No credit card required