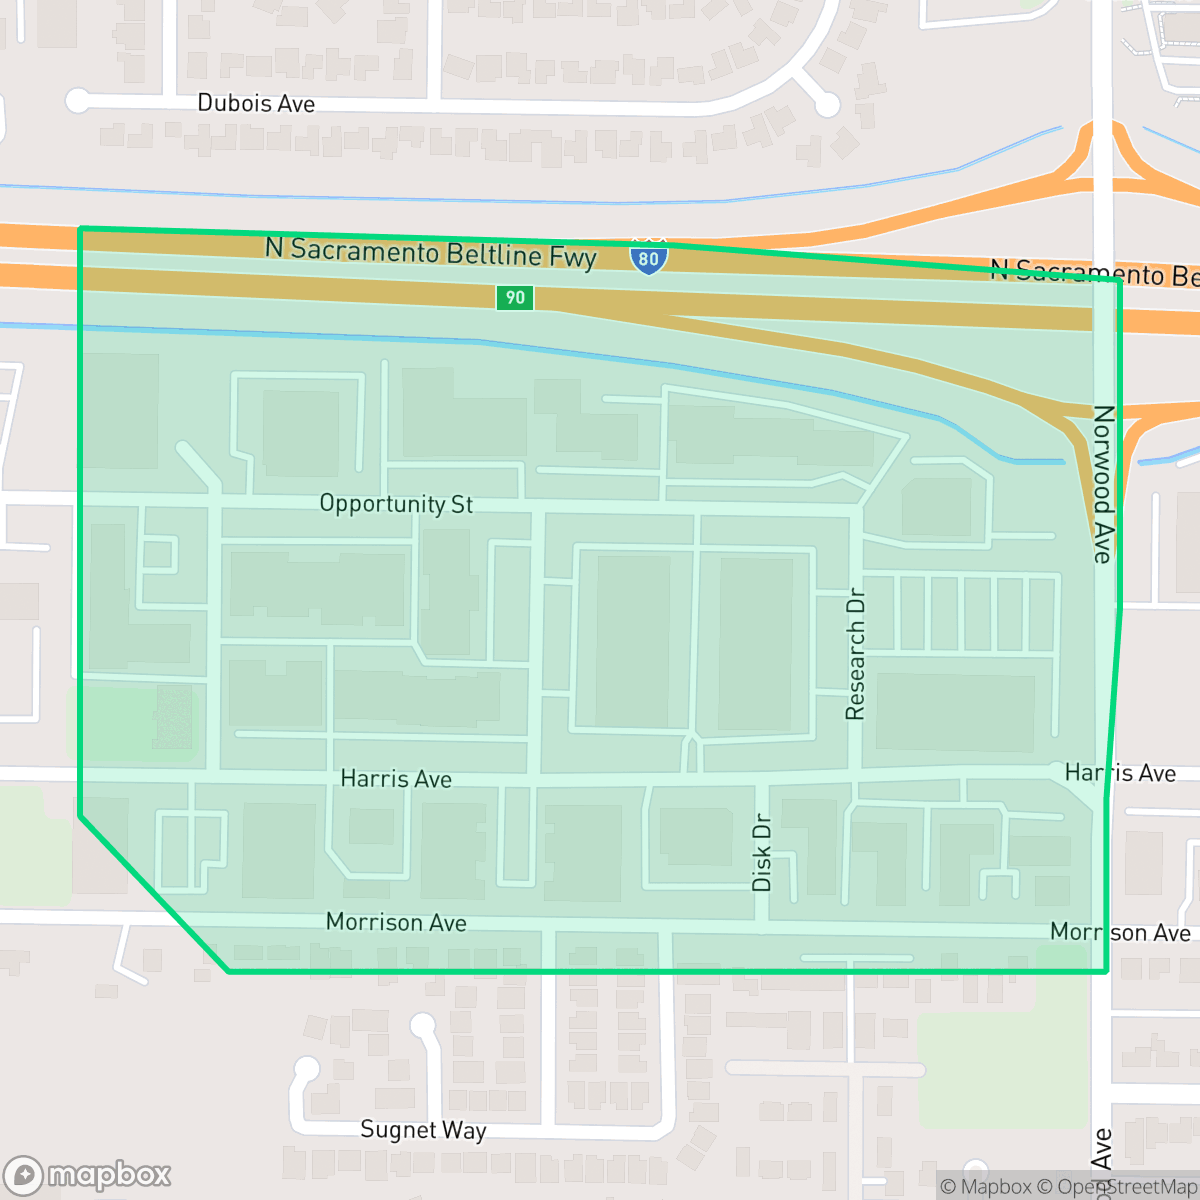
Norwood Tech, Sacramento
Updated June 22, 2026 · 766 residents
Norwood Tech is a quiet, suburban neighborhood in Sacramento characterized by a blend of residential homes and light industrial units. While the area offers reliable flood safety, residents should be prepared for significant road traffic noise and limited walkability.
Key Highlights
About Norwood Tech
Norwood Tech is a suburban enclave in Sacramento that balances residential living with light industrial activity. The landscape features a mix of quiet streets and green space, providing a low-key atmosphere for those who prefer an industrial-adjacent setting. According to iHuus data, the area maintains a consistent suburban feel, though it is defined by its proximity to major transit routes, which contributes to elevated noise levels from constant road traffic. The neighborhood offers a moderate level of privacy, though the presence of commercial units means the environment remains active during daytime hours.
Prospective residents should consider the trade-offs regarding infrastructure and local services. The neighborhood faces challenges with fire safety and requires careful attention to school district performance, as local options like Twin Rivers Unified are navigating transitional periods with significant academic variance. It is best suited for individuals who prioritize suburban accessibility over high-density walkability or a vibrant social scene, and who are comfortable with the acoustic environment of a mixed-use industrial area.
Neighborhood Scores Across 15 Qualities
Residential spacing is slightly below the Sacramento average, featuring a mix of shared walls in complexes and closely spaced houses. Some areas within the neighborhood exhibit higher density with minimal distance between structures.
Residential blocks feature a complete sidewalk network, though major arterial roads act as significant barriers to pedestrian movement. This level of connectivity is lower than the Sacramento average.
Standard tract housing features consistent rooflines and small yards, making the visual landscape slightly less varied than the Sacramento average. According to iHuus data, some apartment complexes in the area also provide access to communal pools.
Sidewalk verges and a small neighborhood park provide some opportunities for pet owners, though overall amenities are slightly below the Sacramento average according to iHuus data.
Large-scale industrial warehouses and dense single-family residential areas create a low-density urban profile. This landscape is largely comparable to the broader Sacramento area in terms of its mix of developed and open land.
Low levels of social activity and limited pedestrian-friendly amenities make this area significantly less lively than the Sacramento average. Most residents will find a quiet, industrial-suburban atmosphere characterized by warehouse corridors and a reliance on vehicles for visiting local services.
Constant noise from nearby airport runways and heavy rail infrastructure makes this area significantly louder than the Sacramento average. Residents can expect minimal acoustic comfort due to the immediate proximity of these transportation hubs.
Air quality levels fluctuate between acceptable and unhealthy, with occasional concerns for sensitive groups. According to iHuus data, the air quality in Norwood Tech is roughly in line with the Sacramento average.
Large logistics hubs and warehouse operations south of the highway introduce significant truck traffic and noise. This level of industrial proximity is notably higher than the Sacramento average, creating a landscape where commercial activity blends with residential areas.
Health insurance coverage among residents is high and remains slightly above the Sacramento average, according to iHuus data.
Voting patterns and census indicators reflect a highly liberal political leaning, consistent with the broader Sacramento area.
Residents live alongside a relatively even mix of young adults, families, and older individuals. According to iHuus data, this age distribution is slightly more concentrated toward a specific demographic compared to the broader Sacramento area.
Flood risk remains notably lower than the Sacramento average, though some residual risk exists as parts of the area sit within a 500 year floodplain according to iHuus data.
Block-Level Insights for Norwood Tech

iHuus Neighborhood Intelligence Insights
Get block-level neighborhood insights for Norwood Tech
- Street-level scores — see how individual blocks compare, not just neighborhood averages
- Micro-zone boundaries — identify quiet pockets, flood boundaries, and walkable clusters before you visit
- 15 dimensions in full — walkability, noise, air quality, school quality, insurance coverage, population age profile, urban/rural index, and more
- Boundary risk alerts — know if your address sits near a block boundary where scores drop, the kind of detail no listing will ever mention
- School insights — individual school ratings and insights, not just district-level data
- Compare before you commit — side-by-side data across neighborhoods, down to block precision
No credit card required
Compare with Any Neighborhood
| Dimension | Norwood Tech | Airport |
|---|---|---|
| 🚶 Walkabilityavg 8.5 | ||
| 🔊 Acoustic Comfortavg 3.22 | ||
| 🤫 Privacy Indexavg 5.34 | ||
| 🎨 Visual Appealavg 6.3 | ||
| 🐕 Dog Friendlinessavg 6.98 | ||
| 🗺️ Urban-Rural Indexavg 6.57 | ||
| ✨ Neighborhood Vibeavg 4.66 | ||
| 🏥 Health Insurance Coverageavg 7.4 | ||
| 🌿 Air Qualityavg 6.12 | ||
| 🏭 Industrial Proximityavg 8.32 | ||
| 🌊 Flood Safetyavg 6.04 | ||
| 🗳️ Ideological Leanavg 9.49 | ||
| 👥 Population Age Profileavg 4.75 | ||
| 🔥 Fire Safetyavg 0 | ||
| 🏫 School Quality |
Norwood Tech Rankings
School Districts Serving Norwood Tech
Robla Elementary School District functions as a high-needs, community-centric organization that is currently in a transitional state, balancing strong social-emotional supports with subpar academic outcomes. While the district earns praise for its diversity, early childhood initiatives, and responsiveness to parent requests for tutoring and wellness, it is hampered by a sharp divide in school-level performance and critical levels of chronic absenteeism. Despite 'Yellow' status on state dashboards and positive growth for English Learners, the low proficiency rates and inconsistencies between campuses like Robla Elementary and Main Avenue reflect a district that is stable enough to maintain operations but still struggling to provide a uniform high-quality educational experience.
Schools
Twin Rivers Unified is currently in a distressed state characterized by extreme academic variance, a recently resolved but historic 12-day labor strike, and significant leadership turnover with the impending departure of its long-term Superintendent. While the district maintains stable credit ratings and has successfully leveraged bond refinancing to save taxpayers money, these fiscal wins are overshadowed by a staffing crisis and poor academic proficiency in core subjects like math and reading. The wide gap between high-performing elementary schools and failing secondary schools, combined with high chronic absenteeism and a workforce emerging from a period of high friction, positions the district as an organization in a fragile transition period rather than a stable 'Blue Chip' entity.
Schools
School Insights for Norwood Tech
Below average outcomes; significant attendance and academic challenges.
School Insights
See what's really behind every school rating near Norwood Tech
- Individual school ratings — each school's own score with outcome context, not just a district average
- Enrollment & class size data — student-to-teacher ratio and how it compares to the state average
- Full demographics breakdown — ethnicity and gender composition for every school in the enrollment zone
- Every school in the district — all schools within the enrollment boundary ranked by rating, not just the closest one
- Grade levels & benchmarks — elementary through high school, with below/above state-average flags
No credit card required