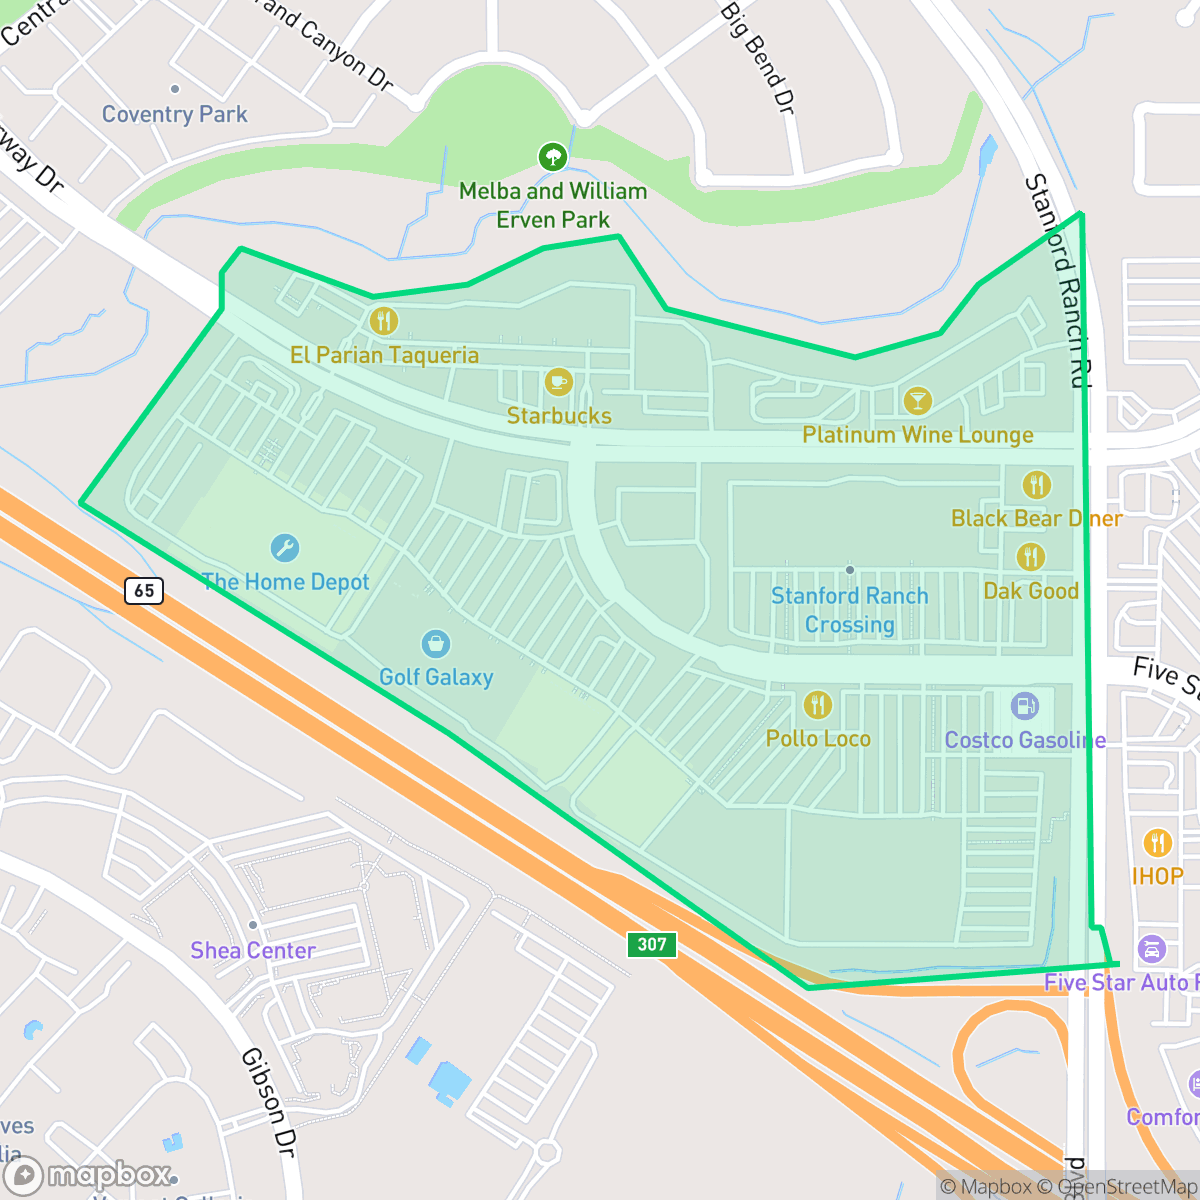
Stanford Crossing, Roseville
Updated June 22, 2026 · 466 residents
Stanford Crossing is a high-energy suburban neighborhood in Roseville known for its diverse dining options and appealing visual character. While the area offers convenient access to local amenities and top-rated schools, residents should be prepared for significant noise levels due to its proximity to major roadways.
Key Highlights
About Stanford Crossing
Stanford Crossing is a vibrant, residential community characterized by a high-energy atmosphere and a variety of local dining establishments, including popular spots like Pho Vegan, Starbucks, and Huckleberry's. The area maintains a high level of visual appeal and is entirely free of industrial hazards, offering a clean, suburban environment. It is well-served by top-tier educational institutions, including the highly-rated Roseville Joint Union High School District, making it a stable choice for those prioritizing academic excellence and community infrastructure.
Potential residents should note that the neighborhood experiences elevated noise levels, primarily from nearby road traffic, which may impact acoustic comfort. While the area provides good walkability and strong health insurance coverage, it is best suited for those who prioritize proximity to commercial amenities and high-performing schools over a secluded, quiet environment. Additionally, as with much of the region, residents should remain proactive regarding fire safety planning.
Neighborhood Scores Across 15 Qualities
Residential spacing varies throughout the area, with some neighbors sharing walls or living in close proximity. According to iHuus data, privacy levels are slightly lower than the Roseville average due to denser building clusters within certain complexes.
Sidewalks and internal paths are available for pedestrians, though major roads and highways act as barriers to movement. This level of walkability is lower than the average seen throughout Roseville.
Residential surroundings consist of established middle-class housing and apartment complexes featuring shared community pools. The visual landscape is slightly below the Roseville average due to the prevalence of larger parking lots and standard tract housing layouts.
Open fields and trails between residential blocks and the highway offer ample exercise space, though pet amenities are slightly below the Roseville average according to iHuus data.
Dense suburban development featuring a mix of apartment complexes, commercial plazas, and office buildings defines this area. This landscape is slightly more developed than the typical Roseville surroundings, according to iHuus data.
Active dining options and social hubs create a more vibrant atmosphere than the typical Roseville neighborhood. According to iHuus data, the area features a notable concentration of local eateries, though the car-dependent layout limits pedestrian connectivity.
Persistent noise from the nearby airport runway is a primary feature of this area. According to iHuus data, acoustic comfort is significantly lower than the Roseville average.
Air quality in this area is consistent with the Roseville average, offering a mix of acceptable and unhealthy days. Sensitive groups should remain aware of occasional periods of concern according to iHuus data.
Residents experience a primarily residential environment with minimal industrial activity. While some large-scale commercial warehouses and retail centers bring truck traffic to certain edges, the area contains noticeably more industrial proximity than the Roseville average according to iHuus data.
Health insurance enrollment is widespread among residents, sitting well above the Roseville average according to iHuus data.
Political leanings in this area are balanced between conservative and liberal perspectives. This distribution represents a more even split than the typical political profile found across Roseville, according to iHuus data.
Residents live alongside a varied demographic of young professionals, families, and seniors. According to iHuus data, this population distribution is slightly more concentrated in certain age brackets than the Roseville average.
Flood risk levels in this area are slightly higher than the Roseville average, though a detailed federal study for this specific location is currently unavailable. Residents should note that the area is categorized with a moderate level of undetermined risk according to iHuus data.
Block-Level Insights for Stanford Crossing

iHuus Neighborhood Intelligence Insights
Get block-level neighborhood insights for Stanford Crossing
- Street-level scores — see how individual blocks compare, not just neighborhood averages
- Micro-zone boundaries — identify quiet pockets, flood boundaries, and walkable clusters before you visit
- 15 dimensions in full — walkability, noise, air quality, school quality, insurance coverage, population age profile, urban/rural index, and more
- Boundary risk alerts — know if your address sits near a block boundary where scores drop, the kind of detail no listing will ever mention
- School insights — individual school ratings and insights, not just district-level data
- Compare before you commit — side-by-side data across neighborhoods, down to block precision
No credit card required
Compare with Any Neighborhood
| Dimension | Stanford Crossing | Blue Oaks |
|---|---|---|
| 🚶 Walkabilityavg 8.87 | ||
| 🔊 Acoustic Comfortavg 4.32 | ||
| 🤫 Privacy Indexavg 5.7 | ||
| 🎨 Visual Appealavg 7.58 | ||
| 🐕 Dog Friendlinessavg 7.74 | ||
| 🗺️ Urban-Rural Indexavg 6.82 | ||
| ✨ Neighborhood Vibeavg 4.77 | ||
| 🏥 Health Insurance Coverageavg 8.58 | ||
| 🌿 Air Qualityavg 6 | ||
| 🏭 Industrial Proximityavg 8.8 | ||
| 🌊 Flood Safetyavg 5.72 | ||
| 🗳️ Ideological Leanavg 3.68 | ||
| 👥 Population Age Profileavg 5.05 | ||
| 🔥 Fire Safetyavg 0.15 | ||
| 🏫 School Quality |
Stanford Crossing Rankings
School Districts Serving Stanford Crossing
Roseville Joint Union High School District is a high-performing 'Blue Chip' organization exhibiting strong academic consistency and operational excellence. The district's portfolio is anchored by elite terminal high schools like Granite Bay and modern facilities like West Park, supported by proactive investments in both Career Technical Education and student mental health infrastructure. While navigating rapid regional growth and the pressures of a high-achievement culture, the district maintains deep community trust, evidenced by successful facility expansions and positive sentiment across diverse educational pathways. Aside from a single continuation school outlier, the district demonstrates the stability, financial health, and academic rigor characteristic of a top-tier educational agency.
Schools
Rocklin Unified School District is a high-performing 'Solid' district characterized by exceptional academic metrics and prestigious secondary schools that consistently outpace state averages. Its operational health is bolstered by strong community support for athletics, successful bond-funded facility upgrades, and expanding CTE programs. While the district maintains a 'Blue Chip' academic profile, it currently faces internal friction due to a polarized Board of Trustees and ongoing legal disputes over social policies, which creates a noticeable divide between its stellar classroom performance and its volatile administrative climate.
Schools
Roseville City Elementary School District is a high-performing, financially stable organization characterized by strong community trust and academic proficiency that significantly exceeds state benchmarks. While the district's portfolio contains a wide performance gap between its top-tier neighborhood schools (rated 8-10) and its struggling campuses (rated 2-3), it maintains a high degree of operational excellence through proactive facility expansion, successful bond management, and robust arts and mental health programming. Current challenges are primarily environmental, driven by rapid population growth in West Roseville leading to student overflows and capacity debates, yet the district remains a top-tier regional choice with a stable leadership outlook.
Schools
School Insights for Stanford Crossing
Below average outcomes; significant attendance and academic challenges.
School Insights
See what's really behind every school rating near Stanford Crossing
- Individual school ratings — each school's own score with outcome context, not just a district average
- Enrollment & class size data — student-to-teacher ratio and how it compares to the state average
- Full demographics breakdown — ethnicity and gender composition for every school in the enrollment zone
- Every school in the district — all schools within the enrollment boundary ranked by rating, not just the closest one
- Grade levels & benchmarks — elementary through high school, with below/above state-average flags
No credit card required