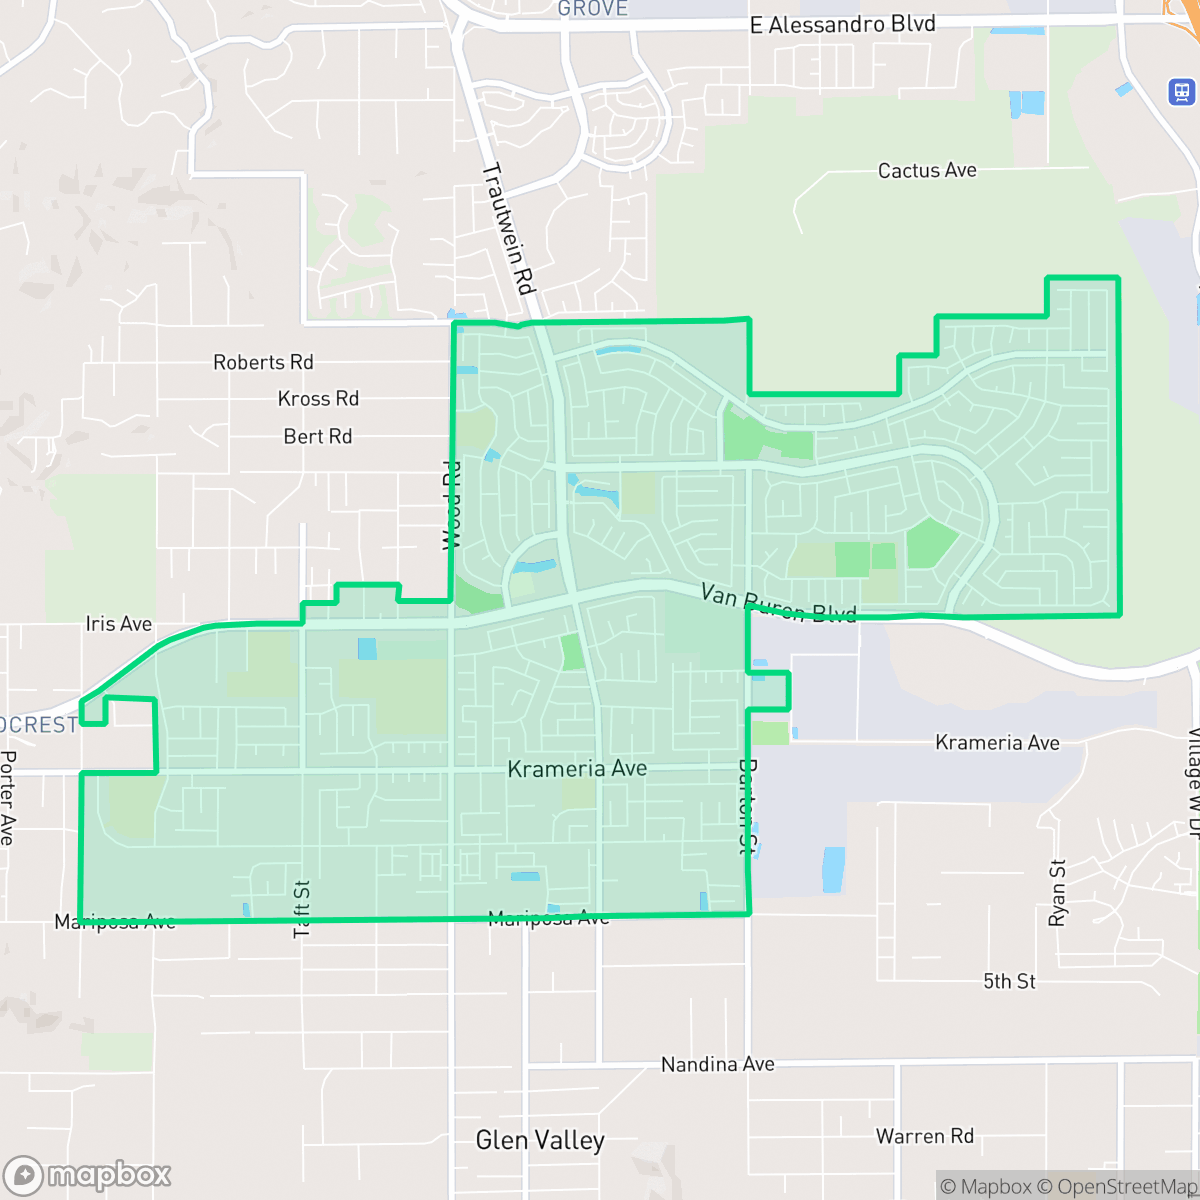
Orangecrest, Riverside
Updated June 22, 2026 · 25,847 residents
Orangecrest is a highly walkable, master-planned community in southeastern Riverside known for its affluent suburban character and well-manicured residential streets. Residents benefit from excellent air quality and a robust network of sidewalks that provide safe access to local parks and schools.
Key Highlights
About Orangecrest
Located in southeastern Riverside, Orangecrest is a master-planned neighborhood that transitioned from agricultural citrus groves to a suburban community following the adoption of the Orangecrest Specific Plan in 1984 and a major city annexation in 1986. Developed primarily during the housing booms of the late 1980s through the 2000s, the neighborhood features modern single-family homes on spacious lots. Orangecrest's agricultural heritage is reflected in its name and lush greenery, while its eastern and southern borders are defined by the adjacent March Air Reserve Base. Today, the community is anchored by the 30-acre Orange Terrace Community Park, which houses a community center and a branch of the Riverside Public Library. Local schools, such as Martin Luther King High School and Amelia Earhart Middle School, further define the neighborhood's family-oriented, modern suburban character.
The neighborhood features a dense suburban landscape defined by large single-family homes, multi-car garages, and a high concentration of private backyard pools. According to iHuus data, the area maintains a high standard of visual appeal and health insurance coverage, reflecting its status as an affluent residential enclave. The community is characterized by quiet streets and a steady rhythm of suburban life, supported by consistent infrastructure that connects residential pockets to recreational spaces and educational facilities. While the area is primarily residential, its design prioritizes pedestrian connectivity, allowing for easy movement throughout the neighborhood's well-connected cul-de-sacs and thoroughfares.
Prospective residents should consider that the area is largely car-oriented, with a limited number of local businesses and social hubs within walking distance. While the air quality is among the best in the city, the neighborhood faces challenges regarding fire and flood safety, and acoustic comfort is occasionally impacted by road traffic. It is best suited for families and individuals seeking a stable, quiet environment with high-quality public amenities and a strong sense of community, provided they are comfortable with the trade-offs of a typical suburban sprawl.
Neighborhood Scores Across 15 Qualities
Housing layouts feature a mix of standard suburban spacing and more compact arrangements. According to iHuus data, privacy levels are largely consistent with the average for Riverside.
Continuous sidewalk networks and clear crossings throughout residential streets make navigating the area on foot easy. This level of pedestrian infrastructure is notably better than the Riverside average, according to iHuus data.
Manicured landscapes, large homes, and a high density of private backyard pools create a visual environment that is more polished than the Riverside average. According to iHuus data, the area features spacious driveways and well-maintained properties throughout the neighborhood.
Abundant public parks, sports fields, and connected greenbelts offer superior walking options for dogs compared to the Riverside average. Extensive sidewalk verges and proximity to open scrubland provide safe, traffic-free routes for pet owners.
Residential pockets transition into undeveloped land and large industrial hubs, offering a landscape slightly more open than the typical Riverside suburban density. According to iHuus data, the area features a mix of established housing tracts and nearby agricultural or fallow fields.
Local activity is subdued, with a landscape characterized by serene residential blocks and low-density industrial pockets. While some pockets offer accessible dining and essential services, the overall rhythm of life is slightly more tranquil than the Riverside average.
A persistent hum from nearby busy streets characterizes the area, representing a level of acoustic activity slightly higher than the Riverside average.
Air quality remains consistently high with very little risk to respiratory health. This level of cleanliness is significantly better than the average found throughout Riverside, according to iHuus data.
Residential and light commercial uses dominate this area, with no heavy industrial hazards or pollution detected. According to iHuus data, the absence of large-scale manufacturing makes this neighborhood even more removed from industrial activity than the Riverside average.
Health insurance access among residents is notably higher than the Riverside average, according to iHuus data.
Conservative voters form a majority in this area, representing a more right-leaning political landscape than the Riverside city average.
Residents experience a balanced distribution of age groups, including young adults, families, and seniors. This demographic variety is slightly more varied than the average found across Riverside.
Flood vulnerability in this area is notably higher than the Riverside average. Residents should anticipate potential for elevated insurance premiums and prepare for significant flood-related risks according to iHuus data.
Fire hazard levels in Orangecrest are significantly high, mirroring the elevated risk found across the rest of Riverside. Residents should be prepared for necessary fire mitigation and safety measures according to iHuus data.
Block-Level Insights for Orangecrest

iHuus Neighborhood Intelligence Insights
Get block-level neighborhood insights for Orangecrest
- Street-level scores — see how individual blocks compare, not just neighborhood averages
- Micro-zone boundaries — identify quiet pockets, flood boundaries, and walkable clusters before you visit
- 15 dimensions in full — walkability, noise, air quality, school quality, insurance coverage, population age profile, urban/rural index, and more
- Boundary risk alerts — know if your address sits near a block boundary where scores drop, the kind of detail no listing will ever mention
- School insights — individual school ratings and insights, not just district-level data
- Compare before you commit — side-by-side data across neighborhoods, down to block precision
No credit card required
Compare with Any Neighborhood
| Dimension | Orangecrest | Airport |
|---|---|---|
| 🚶 Walkabilityavg 7.91 | ||
| 🔊 Acoustic Comfortavg 4.28 | ||
| 🤫 Privacy Indexavg 5.41 | ||
| 🎨 Visual Appealavg 6.73 | ||
| 🐕 Dog Friendlinessavg 6.29 | ||
| 🗺️ Urban-Rural Indexavg 7.07 | ||
| ✨ Neighborhood Vibeavg 4.37 | ||
| 🏥 Health Insurance Coverageavg 6.35 | ||
| 🌿 Air Qualityavg 8.25 | ||
| 🏭 Industrial Proximityavg 8.09 | ||
| 🌊 Flood Safetyavg 1.24 | ||
| 🗳️ Ideological Leanavg 7.01 | ||
| 👥 Population Age Profileavg 4.57 | ||
| 🔥 Fire Safetyavg 0.35 | ||
| 🏫 School Quality |
Orangecrest Rankings
School Districts Serving Orangecrest
Riverside Unified is a stable, mid-tier district characterized by robust specialized programs, such as its Dual Language Immersion and International Baccalaureate pathways, alongside significant internal performance disparities. While the district maintains financial trust through successful bond measures and has avoided the enrollment cliffs seen elsewhere in California, it struggles with a sharp divide between its high-performing southern schools and distressed campuses in older neighborhoods. Current investments in AI-driven security and Career Technical Education (CTE) demonstrate forward-looking management, yet persistent gaps in math proficiency and special education communication keep the district in a 'Mixed/Transition' status.
Schools
Val Verde Unified School District is a solid 'Mixed/Transition' organization characterized by a significant performance gap between its innovative elementary programs and its underperforming middle and alternative high schools. While state data highlights critical academic needs in secondary education (with several schools rated 2/10), the district maintains a stable operational foundation through successful grant acquisition, modern facility upgrades, and a proactive approach to student mental health and STEAM integration. Positive teacher sentiment and a lack of significant board or financial scandals suggest a stable leadership environment, but the district is currently held back from a higher rating by the inconsistent academic floor across its various campuses.
Schools
Moreno Valley Unified School District is currently classified as a distressed organization due to a widening performance gap and mounting fiscal pressures. While high-level programs in Career Technical Education and specific high schools like Valley View maintain strong reputations, the foundational feeder system is struggling, with a majority of schools performing well below state averages. Operational health is challenged by a 'red' status in chronic absenteeism, declining enrollment, and labor unrest regarding competitive compensation. Despite proactive investments in campus security and STEM facilities, the district's overall stability is undermined by the expiration of one-time funding and persistent academic disparities across its elementary and middle school campuses.
Schools
School Insights for Orangecrest
Below average outcomes; significant attendance and academic challenges.
School Insights
See what's really behind every school rating near Orangecrest
- Individual school ratings — each school's own score with outcome context, not just a district average
- Enrollment & class size data — student-to-teacher ratio and how it compares to the state average
- Full demographics breakdown — ethnicity and gender composition for every school in the enrollment zone
- Every school in the district — all schools within the enrollment boundary ranked by rating, not just the closest one
- Grade levels & benchmarks — elementary through high school, with below/above state-average flags
No credit card required