Steinberger, Redwood City
Updated June 22, 2026 · 3,430 residents
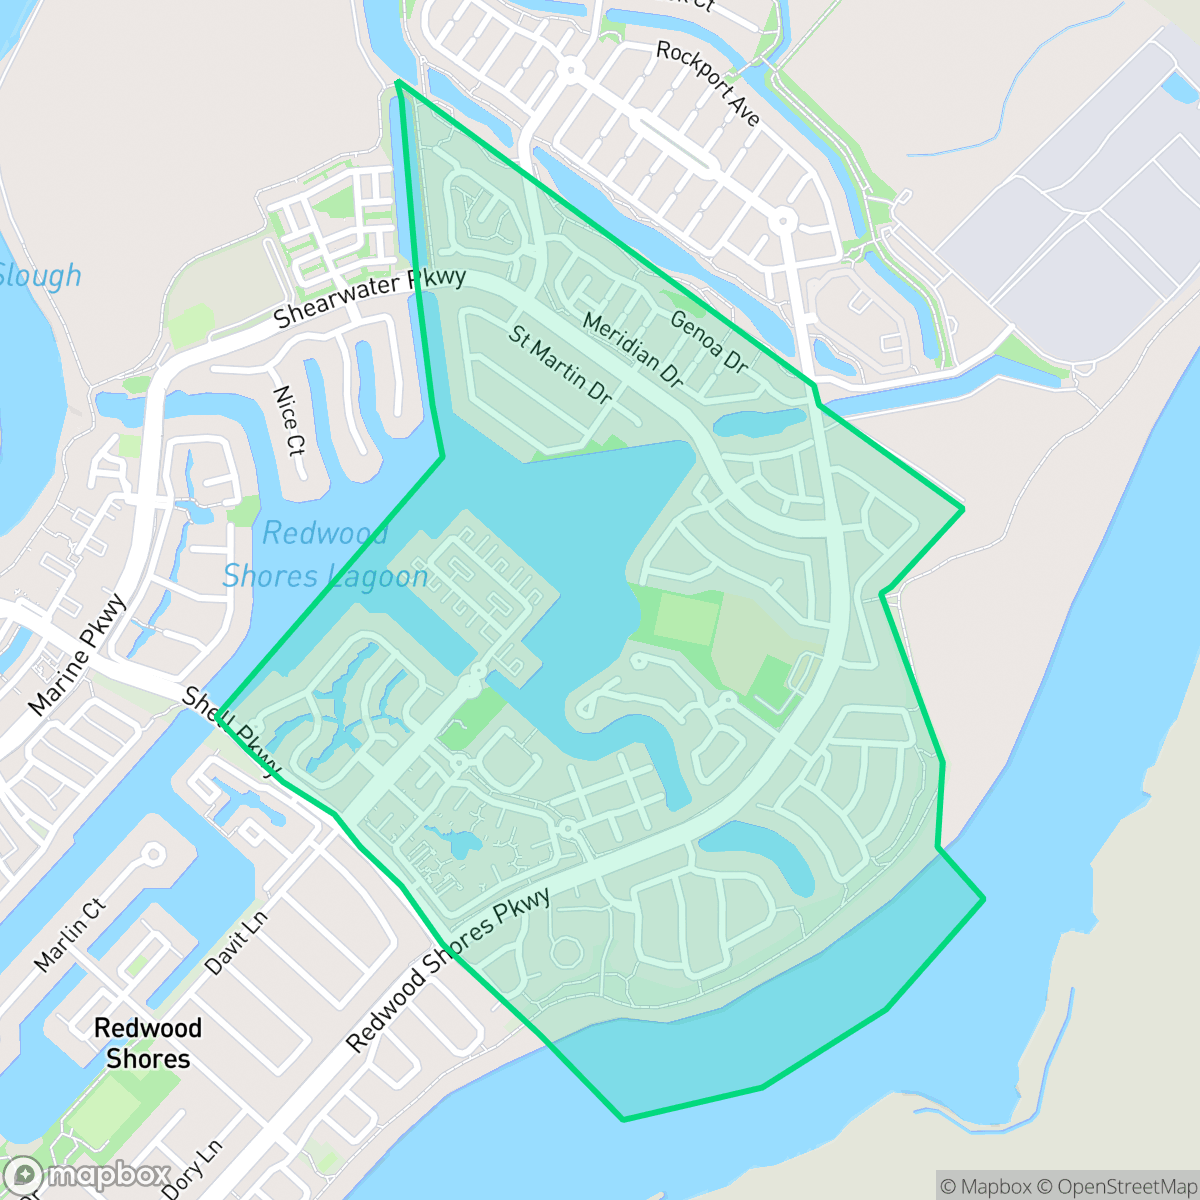
Steinberger is a quiet, affluent waterfront neighborhood in Redwood City characterized by high-density residential clusters and exceptional walkability. Residents enjoy well-maintained green spaces and extensive trails that make the area particularly dog-friendly and peaceful.
Key Highlights
About Steinberger
Steinberger serves as a tranquil, high-density residential pocket along the Redwood City coastline. The neighborhood is defined by its architectural uniformity, featuring complex rooflines and townhome-style living that prioritizes access to communal amenities like pools and landscaped grounds. With a high score for industrial proximity, the area remains entirely focused on residential and recreational use, free from large-scale commercial activity.
While the environment offers a serene atmosphere with high acoustic comfort, it maintains a lower liveliness profile, making it better suited for those seeking quietude over a bustling urban scene. According to iHuus data, the community benefits from excellent walkability and high health insurance coverage, though the dense housing layout results in limited personal privacy. Families are served by the high-performing Belmont-Redwood Shores Elementary School District, though prospective residents should consider the ongoing operational transitions within the local high school district.
Neighborhood Scores Across 15 Qualities
Building proximity varies between townhouse and apartment layouts, often resulting in less privacy than the Redwood City average. Some residents may experience minimal gaps between structures or shared walls according to iHuus data.
Continuous sidewalks and pedestrian bridges ensure safe, seamless connectivity throughout the area. This level of pedestrian infrastructure is notably superior to the Redwood City average.
Modern developments and waterfront properties feature complex architecture and well-maintained landscaping. According to iHuus data, the visual environment is notably more polished than the Redwood City average.
Extensive waterfront trails and wide green corridors throughout the residential clusters offer ample space for pets. According to iHuus data, these interconnected green spaces provide significantly more walking opportunities for dogs than the Redwood City average.
Open land and woodland are frequent throughout the area, providing a slightly more rural atmosphere than the typical Redwood City environment. According to iHuus data, the landscape features scattered homes set among fields and natural marshlands.
Low density and minimal commercial activity define this area, which offers much less social activity and fewer business options than the Redwood City average. Residents can expect a serene, suburban atmosphere with very few local services or social spots within walking distance.
Acoustic levels remain notably low, with only infrequent sounds from distant trains or vehicles. This area is significantly quieter than the Redwood City average, according to iHuus data.
Air quality levels here are generally acceptable, though sensitive groups may experience occasional concern on certain days. This rating is roughly in line with the average seen across Redwood City, according to iHuus data.
Most streets are quiet and residential, though proximity to a wastewater treatment plant and a water tank introduces some light utility presence. This level of industrial activity is slightly higher than the Redwood City average.
Nearly all residents in Steinberger are covered by health insurance, which represents a significantly higher rate of coverage than the Redwood City average.
Voting patterns and census indicators reflect a deeply liberal political leaning, consistent with the broader Redwood City area.
Residents live alongside a balanced mix of young professionals, families, and seniors. This demographic distribution is largely consistent with the broader Redwood City area, according to iHuus data.
Residual flood risk exists due to the area being within a 500-year floodplain, though safety levels remain significantly higher than the Redwood City average according to iHuus data.
Block-Level Insights for Steinberger

iHuus Neighborhood Intelligence Insights
Get block-level neighborhood insights for Steinberger
- Street-level scores — see how individual blocks compare, not just neighborhood averages
- Micro-zone boundaries — identify quiet pockets, flood boundaries, and walkable clusters before you visit
- 15 dimensions in full — walkability, noise, air quality, school quality, insurance coverage, population age profile, urban/rural index, and more
- Boundary risk alerts — know if your address sits near a block boundary where scores drop, the kind of detail no listing will ever mention
- School insights — individual school ratings and insights, not just district-level data
- Compare before you commit — side-by-side data across neighborhoods, down to block precision
No credit card required
Compare with Any Neighborhood
| Dimension | Steinberger | Ampex |
|---|---|---|
| 🚶 Walkabilityavg 8.4 | ||
| 🔊 Acoustic Comfortavg 4.29 | ||
| 🤫 Privacy Indexavg 4.9 | ||
| 🎨 Visual Appealavg 7 | ||
| 🐕 Dog Friendlinessavg 6.12 | ||
| 🗺️ Urban-Rural Indexavg 6.63 | ||
| ✨ Neighborhood Vibeavg 4.41 | ||
| 🏥 Health Insurance Coverageavg 7.97 | ||
| 🌿 Air Qualityavg 6.23 | ||
| 🏭 Industrial Proximityavg 8.38 | ||
| 🌊 Flood Safetyavg 4.84 | ||
| 🗳️ Ideological Leanavg 9.73 | ||
| 👥 Population Age Profileavg 4.84 | ||
| 🔥 Fire Safetyavg 0.22 | ||
| 🏫 School Quality |
Steinberger Rankings
School Districts Serving Steinberger
Belmont-Redwood Shores Elementary School District is a premier 'Blue Chip' organization characterized by exceptional academic performance, robust financial stability, and high community trust. With a portfolio dominated by top-tier ratings and a middle school that acts as a rigorous academic anchor, the district consistently outperforms state benchmarks. While a 'pressure cooker' environment and localized traffic issues are noted in anecdotal reports, the district's successful management of bond measures for infrastructure and its ability to maintain strong financial reserves despite state funding fluctuations confirm its status as a stable, high-performing corporate entity.
Schools
Sequoia Union High School District remains an academic powerhouse with high-performing flagship schools like Carlmont and Menlo-Atherton consistently outpacing state standards; however, it is currently in a state of operational transition and controversy. The district faces significant community backlash following the decision to close the newly built TIDE Academy to address a $6 million deficit, alongside parent concerns regarding the removal of honors-level 'bridge' courses for younger students. While the core academic portfolio is robust, recent lawsuits involving staff misconduct and ongoing debates over curriculum equity and fiscal management signal internal instability that offsets its high-ranking test scores.
Schools
School Insights for Steinberger
Below average outcomes; significant attendance and academic challenges.
School Insights
See what's really behind every school rating near Steinberger
- Individual school ratings — each school's own score with outcome context, not just a district average
- Enrollment & class size data — student-to-teacher ratio and how it compares to the state average
- Full demographics breakdown — ethnicity and gender composition for every school in the enrollment zone
- Every school in the district — all schools within the enrollment boundary ranked by rating, not just the closest one
- Grade levels & benchmarks — elementary through high school, with below/above state-average flags
No credit card required