Southeast, Rancho Cucamonga
Updated June 22, 2026 · 3,108 residents
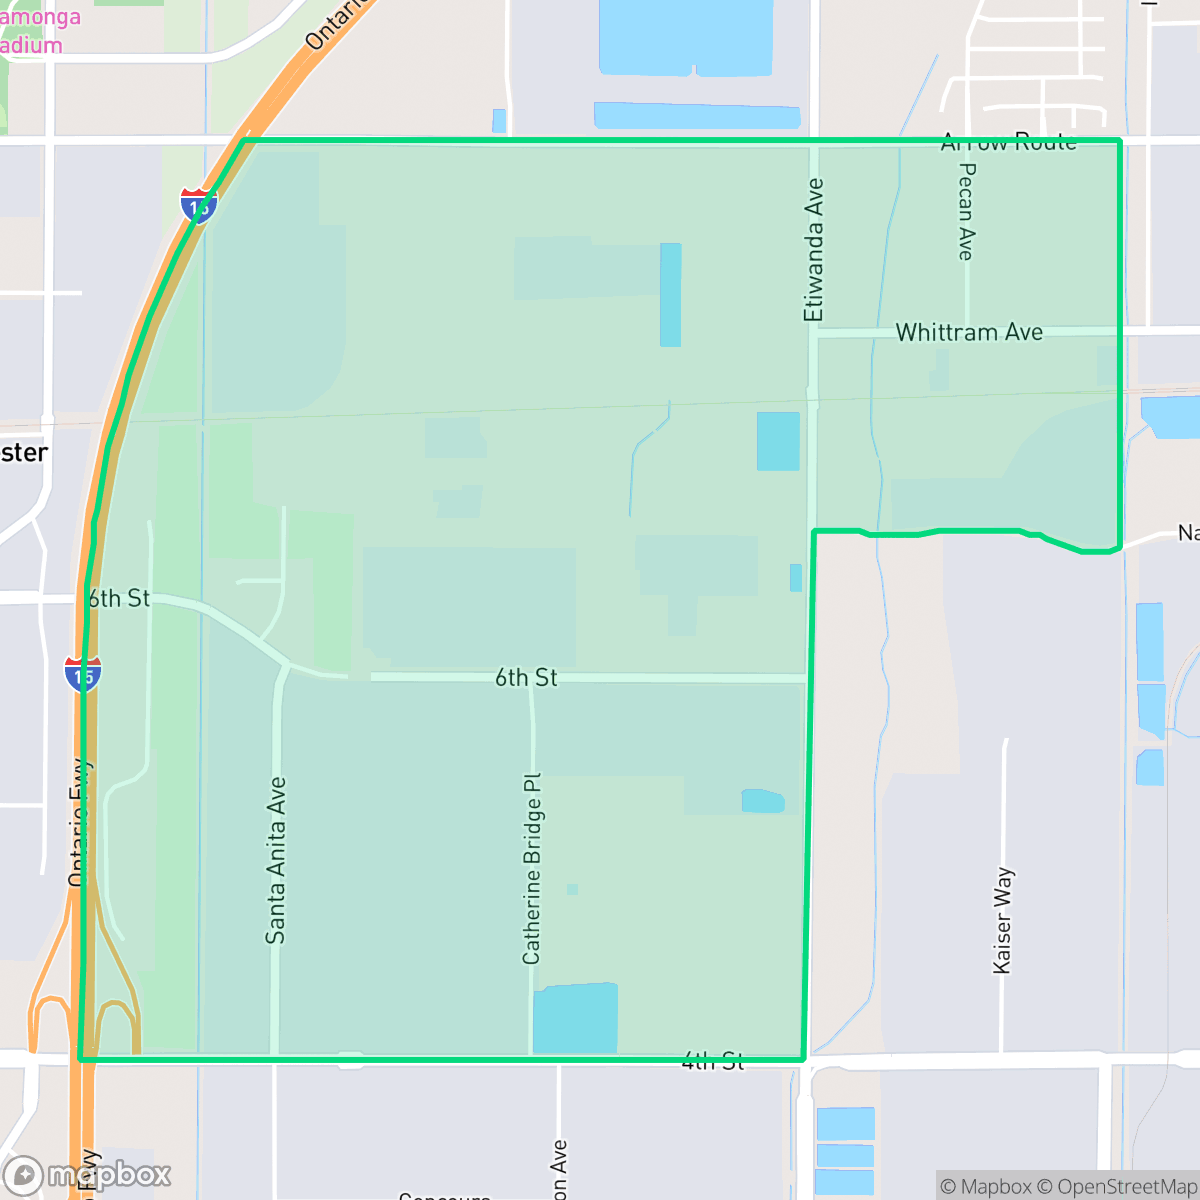
The Southeast neighborhood in Rancho Cucamonga is a heavily industrial district dominated by large-scale logistics hubs and warehouse infrastructure. It is a car-dependent area with limited local services and high levels of road traffic noise.
Key Highlights
About Southeast
Southeast is characterized by its dense industrial landscape, featuring massive distribution centers and significant logistics operations. The area is defined by its proximity to major freight corridors and industrial facilities, including utility plants and wastewater infrastructure. According to iHuus data, the neighborhood functions primarily as a logistics hub rather than a residential community, with expansive paved yards and heavy vehicle traffic defining the local environment. For those considering the area, it is important to note the significant trade-offs regarding livability. The district experiences high noise levels primarily from road traffic and offers very low walkability, making personal vehicle reliance essential. While the neighborhood provides high flood safety, it lacks the recreational amenities and quiet residential atmosphere found in other parts of the city. It is best suited for industrial operations and logistics-related commerce rather than traditional residential living.
Neighborhood Scores Across 15 Qualities
Homes are positioned in close proximity to one another with minimal separation between structures. This level of density is significantly higher than the average found throughout Rancho Cucamonga.
Limited sidewalk availability and high traffic volumes make pedestrian travel uncomfortable. Walking for daily errands is significantly more challenging here than in the rest of Rancho Cucamonga, according to iHuus data.
Standard tract housing with modest yards and uniform rooflines defines the area, which offers less visual variety than the Rancho Cucamonga average.
Minimal greenery and narrow street verges offer few opportunities for outdoor exercise. According to iHuus data, this area is significantly less dog friendly than the rest of Rancho Cucamonga due to the prevalence of fenced lots and sparse vegetation.
Large-scale warehouses and logistics infrastructure characterize much of the landscape, creating a mix of industrial yards and nearby residential tracts. This area features a slightly more developed industrial density than the city average, according to iHuus data.
Primarily composed of residential blocks and warehouse corridors, this area lacks a distinct commercial character and offers significantly less activity than the rest of Rancho Cucamonga. Most residents will find a quiet, car-dependent landscape with very few local businesses or social hubs nearby.
Frequent noise from nearby freeways and railroad tracks characterizes this area. According to iHuus data, acoustic comfort is significantly lower than the average for Rancho Cucamonga.
Air quality in this area typically experiences a mix of acceptable and unhealthy days; according to iHuus data, these conditions are consistent with the city average.
Significant industrial activity, including a wastewater treatment plant and massive logistics hubs with heavy truck traffic, makes this area much more industrial than the rest of the city. According to iHuus data, the neighborhood is dominated by large warehouses, loading docks, and high volumes of semi-truck movement.
Health insurance coverage is significantly lower than the Rancho Cucamonga average, according to iHuus data. Residents in this area face much higher rates of being uninsured compared to the rest of the city.
Political leanings in this area are notably more conservative than the Rancho Cucamonga average, according to iHuus data.
Residents live alongside a balanced blend of young adults, families, and older individuals. This demographic distribution is slightly more varied than the typical profile found across Rancho Cucamonga.
Flood risk in this area is notably higher than the city average, as some parts of the neighborhood fall within a 500-year floodplain. According to iHuus data, residents should remain aware of potential residual flood risks during extreme weather events.
Block-Level Insights for Southeast

iHuus Neighborhood Intelligence Insights
Get block-level neighborhood insights for Southeast
- Street-level scores — see how individual blocks compare, not just neighborhood averages
- Micro-zone boundaries — identify quiet pockets, flood boundaries, and walkable clusters before you visit
- 15 dimensions in full — walkability, noise, air quality, school quality, insurance coverage, population age profile, urban/rural index, and more
- Boundary risk alerts — know if your address sits near a block boundary where scores drop, the kind of detail no listing will ever mention
- School insights — individual school ratings and insights, not just district-level data
- Compare before you commit — side-by-side data across neighborhoods, down to block precision
No credit card required
Compare with Any Neighborhood
| Dimension | Southeast | Central North |
|---|---|---|
| 🚶 Walkabilityavg 8.76 | ||
| 🔊 Acoustic Comfortavg 3.76 | ||
| 🤫 Privacy Indexavg 4.95 | ||
| 🎨 Visual Appealavg 7.01 | ||
| 🐕 Dog Friendlinessavg 6.09 | ||
| 🗺️ Urban-Rural Indexavg 6.71 | ||
| ✨ Neighborhood Vibeavg 3.87 | ||
| 🏥 Health Insurance Coverageavg 8.11 | ||
| 🌿 Air Qualityavg 6.02 | ||
| 🏭 Industrial Proximityavg 8.19 | ||
| 🌊 Flood Safetyavg 3.4 | ||
| 🗳️ Ideological Leanavg 5.31 | ||
| 👥 Population Age Profileavg 4.85 | ||
| 🔥 Fire Safetyavg 0.22 | ||
| 🏫 School Quality |
Southeast Rankings
School Districts Serving Southeast
Etiwanda Elementary School District is a premier educational organization characterized by top-tier academic performance, with proficiency scores significantly exceeding California state averages and a portfolio dominated by high-ranking schools. The district maintains strong community trust, evidenced by high demand that has necessitated the closure of several 'impacted' campuses to transfers. Financial management is robust and transparent, prioritizing instructional spending and diverse programs like arts and music. Despite a planned leadership transition in 2026, the district’s stable operations, high teacher quality, and consistent parent satisfaction solidify its standing as a high-performing 'Blue Chip' entity.
Schools
Chaffey Joint Union High School District is a solid and stable high-performing organization, currently ranked as the premier district in San Bernardino County. With a portfolio of high schools that largely range from 6/10 to 9/10, the district demonstrates consistent academic success, particularly in English Language Arts and college readiness. While math proficiency remains a strategic area for growth and anecdotal reports suggest minor social-environment concerns on campus, the district's proactive leadership, diverse extracurricular offerings, and strong financial footing—highlighted by recent facility upgrades and successful community engagement initiatives—solidify its status as a top-tier educational provider.
Schools
Fontana Unified School District is a large, operationally active organization in transition, characterized by a significant performance gap between its premier academies and its struggling neighborhood schools. While the district earns high marks for its specialized Career Technical Education (CTE), dual immersion programs, and robust extracurriculars, it is hindered by low standardized test scores in middle school math and high staff turnover in special education. Recent investments in technology, campus security, and facility modernizations indicate a proactive administration and stable funding, yet the wide variance in school-level ratings (ranging from 1/10 to 10/10) prevents a higher overall designation, making it a 'Mixed/Transition' district.
Schools
Cucamonga Elementary School District is a distressed district characterized by significantly below-average academic proficiency and persistent operational challenges. Despite the district's commendable efforts in providing community support services and managing a diverse student population, ground truth metrics reveal a sharp decline in academic standing, with math and reading scores trailing state averages by nearly 50%. While safety measures and community programs remain active, the district's low school ratings (as low as 2/10), high chronic absenteeism, and the lack of top-performing schools indicate an organization struggling to meet state standards and retain community confidence when compared to neighboring high-performing districts.
Schools
School Insights for Southeast
Below average outcomes; significant attendance and academic challenges.
School Insights
See what's really behind every school rating near Southeast
- Individual school ratings — each school's own score with outcome context, not just a district average
- Enrollment & class size data — student-to-teacher ratio and how it compares to the state average
- Full demographics breakdown — ethnicity and gender composition for every school in the enrollment zone
- Every school in the district — all schools within the enrollment boundary ranked by rating, not just the closest one
- Grade levels & benchmarks — elementary through high school, with below/above state-average flags
No credit card required