Etiwanda, Rancho Cucamonga
Updated · 25,984 residents
Etiwanda is a densely developed suburban community in Rancho Cucamonga known for its high-performing schools and extensive sidewalk network. While the area offers a quiet, residential atmosphere with ample green space, residents often experience significant noise from nearby freeway traffic and limited local commercial options.
Key Highlights
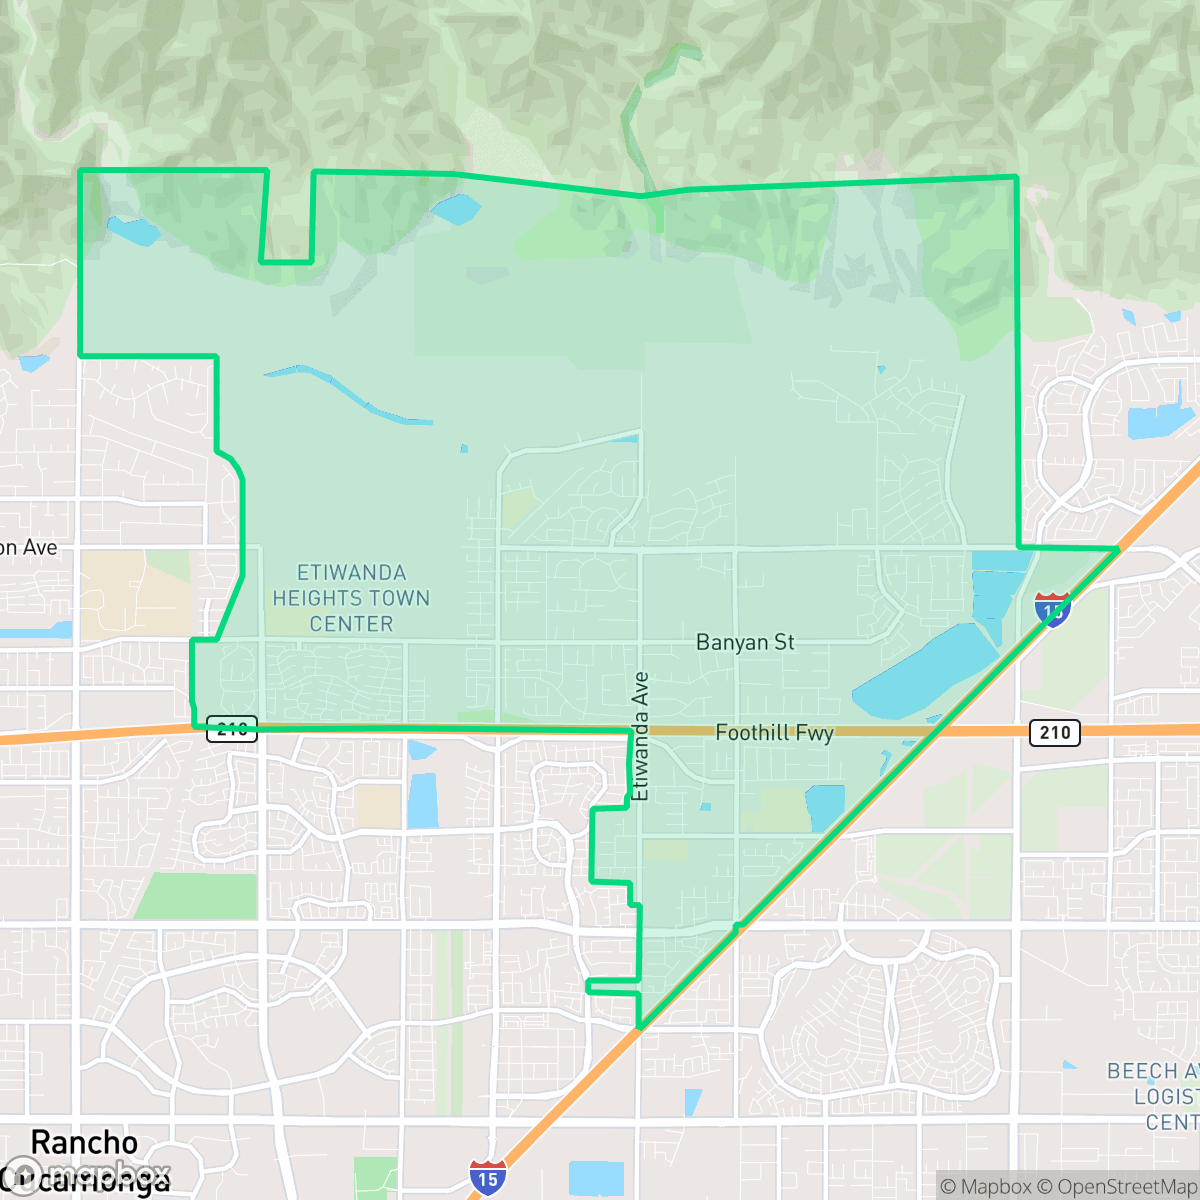
About Etiwanda
Founded in 1881 by Canadian brothers George and William Chaffey, Etiwanda was established as Southern California’s first planned agricultural irrigation colony. Built on land purchased from retired Portuguese sea captain Joseph Garcia, the community pioneered several regional milestones. It introduced the area’s first mutual water company, hosted Southern California’s first long-distance telephone call in 1882, and became the first local community illuminated by hydroelectric power when George Chaffey rigged a dynamo to an irrigation water wheel. Today, Etiwanda’s heritage is preserved by the Etiwanda Historical Society through landmarks like the Chaffey-Garcia House, the 1884 catalog-built Chaffey-Isle House, and a restored 1914 Mission Revival Pacific Electric Railway depot. In 1977, Etiwanda incorporated with Alta Loma and Cucamonga to form the city of Rancho Cucamonga.
The neighborhood presents a classic suburban layout characterized by tightly packed single-family homes and a robust infrastructure of sidewalks that connect residents to local parks like Day Creek and San Sevaine. It is widely recognized for its top-tier educational institutions, including several schools that consistently earn high marks for academic proficiency. According to iHuus data, the area maintains a strong visual appeal through its well-managed green spaces and affluent residential character, making it a preferred choice for families prioritizing educational access.
Prospective residents should note that the area features a quiet rhythm that often lacks immediate access to diverse retail or dining, requiring a vehicle for most daily errands. The neighborhood experiences notable acoustic challenges due to its proximity to major highway interchanges, and the presence of large-scale flood control basins and earthworks adds an industrial dimension to the landscape. While the community offers a highly walkable environment for pedestrians, the combination of high density and traffic noise defines the primary livability trade-offs for those considering a move to this part of Rancho Cucamonga.
Neighborhood Scores Across 15 Qualities
Residential spacing is typical for suburban developments, offering a moderate level of buffer between neighbors that is slightly higher than the Rancho Cucamonga average. According to iHuus data, many homes feature shared boundary fences and relatively close proximity to adjacent properties.
Residential streets and cul-de-sacs feature a consistent sidewalk network and safe crossings, though major highway interchanges act as significant barriers to movement. This level of walkability is slightly lower than the average for Rancho Cucamonga due to these fragmented pedestrian paths near large-scale infrastructure.
Large detached homes, multi-car driveways, and frequent private backyard pools characterize this area. The neighborhood offers a more polished aesthetic than the average for Rancho Cucamonga, according to iHuus data.
Access to dog walking areas varies by street, as some parts of the neighborhood feature large central parks and wide green verges while others rely primarily on private fenced yards. This level of accessibility is roughly comparable to the city average, according to iHuus data.
Residential areas feature a mix of suburban housing and open, undeveloped land, offering a slightly more open landscape than the average for Rancho Cucamonga. According to iHuus data, the neighborhood contains pockets of both dense suburban tracts and rugged, unpopulated terrain.
Low density and significant open space characterize this area, which features a tranquil atmosphere with very few local businesses. Residents will find the environment primarily quiet and serene, though a vehicle is typically necessary for most shopping and dining needs as the neighborhood sits slightly below the city average for activity.
Frequent noise from nearby freeways and railroad corridors characterizes this area. According to iHuus data, acoustic comfort in Etiwanda is significantly lower than the Rancho Cucamonga average.
Air quality levels are consistent with the Rancho Cucamonga average, presenting a mix of acceptable and unhealthy days that may occasionally affect sensitive groups.
Residential life here is free from heavy manufacturing, warehouses, or hazardous industrial facilities, which is even more pronounced than the city average. According to iHuus data, the area is composed primarily of homes, open spaces, and standard municipal utilities.
Health insurance access is widespread among residents, sitting well above the Rancho Cucamonga average according to iHuus data.
Political perspectives are distributed relatively evenly across the area, showing a more balanced ideological split than the broader Rancho Cucamonga average according to iHuus data.
Residents live alongside a diverse range of age groups, including families and older adults. This demographic spread is largely consistent with the broader Rancho Cucamonga area according to iHuus data.
Flood risk in this area is higher than the Rancho Cucamonga average due to undetermined levels of risk. According to iHuus data, the lack of a detailed FEMA study means residents should remain aware of potential localized drainage concerns.
Wildfire danger is a critical concern in this area, representing a much higher hazard level than the Rancho Cucamonga average. According to iHuus data, residents should prioritize maximum fire protection measures due to the severe risk present in the neighborhood.
Address-Level Insights for Etiwanda


iHuus Neighborhood Intelligence Insights
Get address-level neighborhood insights for Etiwanda
- Street-level scores — see how individual blocks compare, not just neighborhood averages
- Micro-zone boundaries — identify quiet pockets, flood boundaries, and walkable clusters before you visit
- 15 dimensions in full — walkability, noise, air quality, school quality, insurance coverage, population age profile, urban/rural index, and more
- Boundary risk alerts — know if your address sits near a block boundary where scores drop, the kind of detail no listing will ever mention
- School insights — individual school ratings and insights, not just district-level data
- Compare before you commit — side-by-side data across neighborhoods, down to block precision
No credit card required
Compare with Any Neighborhood
| Dimension | Etiwanda | Central North |
|---|---|---|
| 🚶 Walkabilityavg 8.76 | ||
| 🔊 Acoustic Comfortavg 3.76 | ||
| 🤫 Privacy Indexavg 4.95 | ||
| 🎨 Visual Appealavg 7.01 | ||
| 🐕 Dog Friendlinessavg 6.09 | ||
| 🗺️ Urban-Rural Indexavg 6.71 | ||
| ✨ Neighborhood Vibeavg 3.87 | ||
| 🏥 Health Insurance Coverageavg 8.11 | ||
| 🌿 Air Qualityavg 6.02 | ||
| 🏭 Industrial Proximityavg 8.19 | ||
| 🌊 Flood Safetyavg 3.4 | ||
| 🗳️ Ideological Leanavg 5.31 | ||
| 👥 Population Age Profileavg 4.85 | ||
| 🔥 Fire Safetyavg 0.22 | ||
| 🏫 School Quality |
Etiwanda Rankings
School Districts Serving Etiwanda
School Insights for Etiwanda
Below average outcomes; significant attendance and academic challenges.
School Insights
See what's really behind every school rating near Etiwanda
- Individual school ratings — each school's own score with outcome context, not just a district average
- Enrollment & class size data — student-to-teacher ratio and how it compares to the state average
- Full demographics breakdown — ethnicity and gender composition for every school in the enrollment zone
- Every school in the district — all schools within the enrollment boundary ranked by rating, not just the closest one
- Grade levels & benchmarks — elementary through high school, with below/above state-average flags
No credit card required