Eastside, Rancho Cucamonga
Updated June 22, 2026 · 5,096 residents
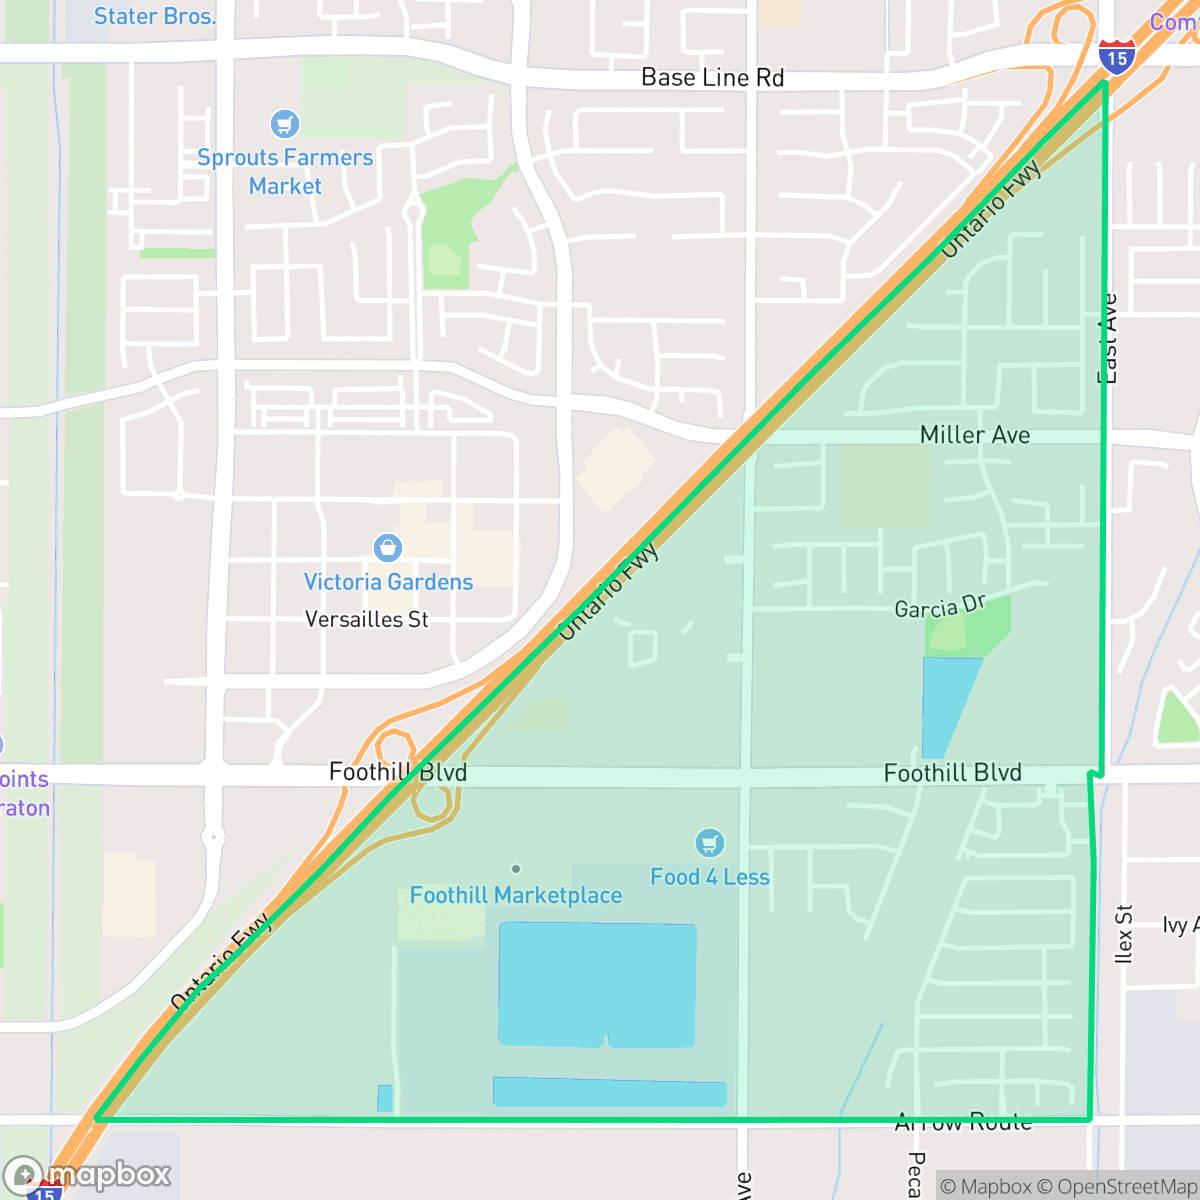
The Eastside neighborhood in Rancho Cucamonga is a suburban area defined by a mix of residential tracts and significant industrial logistics infrastructure. While the area offers good sidewalk connectivity for pedestrians, residents often experience elevated noise levels from nearby freeways and rail lines.
Key Highlights
About Eastside
Eastside functions as a transition zone between residential living and industrial operations, featuring a landscape of standard tract housing alongside major logistics hubs. The neighborhood maintains a steady suburban rhythm, with a population that includes a diverse mix of families, young professionals, and seniors. While the area is generally accessible to those on foot due to established sidewalk networks, the presence of large freeway interchanges creates physical barriers that influence local movement patterns. The visual character remains consistent with typical suburban developments, featuring modest yard spaces and uniform housing designs. Prospective residents should consider the trade-offs associated with the area's industrial proximity, which brings increased truck traffic and higher noise levels. The neighborhood presents environmental challenges, including elevated risks related to fire and flooding, and limited access to public green spaces for pet owners. However, the area benefits from high rates of health insurance coverage and access to a variety of educational options, ranging from highly-rated elementary districts to diverse high school programs.
Neighborhood Scores Across 15 Qualities
Residential spacing in this area is consistent with the city average, featuring detached homes with small private yard buffers. Some pockets of the neighborhood exhibit a more closely packed layout with minimal distance between neighboring structures.
Sidewalks are widely available on many residential streets and major roads, though a large freeway interchange acts as a significant barrier to pedestrian movement. While the network is largely intact, walkability is slightly lower than the Rancho Cucamonga average due to these traffic-related obstacles.
Residential scenery consists primarily of uniform tract housing with moderate yard space. While some affluent areas feature well-manicured properties and private pools, the overall visual appeal is slightly below the Rancho Cucamonga average according to iHuus data.
Public park access and wide grassy verges are sparse in this area, making it less dog friendly than the typical Rancho Cucamonga neighborhood. Most greenery is contained within private fenced backyards, and walking routes lack significant public green space according to iHuus data.
A blend of residential tracts and large-scale logistics warehouses characterizes the landscape. This area feels slightly more developed than the city average, transitioning between low-density housing and dense industrial zones according to iHuus data.
A mix of light industrial units, green spaces, and diverse dining options creates a functional energy that is slightly more active than the city average. While social hubs and local eateries are present, the area remains primarily car-dependent due to the proximity of highways and warehouses.
Frequent noise from nearby freeways and railroad tracks is common in this area. According to iHuus data, acoustic comfort is significantly lower than the average for the rest of the city.
Air quality in this area fluctuates between acceptable and unhealthy levels, mirroring the broader city average. Sensitive groups may experience occasional concern during periods of poor air quality, according to iHuus data.
Large-scale logistics hubs and warehouses with frequent semi-truck traffic are present, making industrial proximity notably higher than the Rancho Cucamonga average. While some areas remain exclusively residential, significant portions of the neighborhood feature heavy commercial loading docks and industrial storage infrastructure.
Health insurance access is widespread among residents in this area, sitting slightly above the Rancho Cucamonga average according to iHuus data.
Political leanings in this area trend more liberal than the Rancho Cucamonga average, featuring a majority liberal population with a modest opposing presence according to iHuus data.
Residents live alongside a balanced variety of young adults, families, and seniors. This age distribution is slightly lower than the average across Rancho Cucamonga according to iHuus data.
Significant flood vulnerability exists in this area, representing a much higher risk than the Rancho Cucamonga average. Residents should prepare for potentially elevated or prohibitive flood insurance costs according to iHuus data.
Significant fire hazards are present in this area, representing a much higher risk level than the Rancho Cucamonga average. Residents should prioritize enhanced mitigation strategies and wildfire preparedness according to iHuus data.
Block-Level Insights for Eastside

iHuus Neighborhood Intelligence Insights
Get block-level neighborhood insights for Eastside
- Street-level scores — see how individual blocks compare, not just neighborhood averages
- Micro-zone boundaries — identify quiet pockets, flood boundaries, and walkable clusters before you visit
- 15 dimensions in full — walkability, noise, air quality, school quality, insurance coverage, population age profile, urban/rural index, and more
- Boundary risk alerts — know if your address sits near a block boundary where scores drop, the kind of detail no listing will ever mention
- School insights — individual school ratings and insights, not just district-level data
- Compare before you commit — side-by-side data across neighborhoods, down to block precision
No credit card required
Compare with Any Neighborhood
| Dimension | Eastside | Central North |
|---|---|---|
| 🚶 Walkabilityavg 8.76 | ||
| 🔊 Acoustic Comfortavg 3.76 | ||
| 🤫 Privacy Indexavg 4.95 | ||
| 🎨 Visual Appealavg 7.01 | ||
| 🐕 Dog Friendlinessavg 6.09 | ||
| 🗺️ Urban-Rural Indexavg 6.71 | ||
| ✨ Neighborhood Vibeavg 3.87 | ||
| 🏥 Health Insurance Coverageavg 8.11 | ||
| 🌿 Air Qualityavg 6.02 | ||
| 🏭 Industrial Proximityavg 8.19 | ||
| 🌊 Flood Safetyavg 3.4 | ||
| 🗳️ Ideological Leanavg 5.31 | ||
| 👥 Population Age Profileavg 4.85 | ||
| 🔥 Fire Safetyavg 0.22 | ||
| 🏫 School Quality |
Eastside Rankings
School Districts Serving Eastside
Etiwanda Elementary School District is a premier educational organization characterized by top-tier academic performance, with proficiency scores significantly exceeding California state averages and a portfolio dominated by high-ranking schools. The district maintains strong community trust, evidenced by high demand that has necessitated the closure of several 'impacted' campuses to transfers. Financial management is robust and transparent, prioritizing instructional spending and diverse programs like arts and music. Despite a planned leadership transition in 2026, the district’s stable operations, high teacher quality, and consistent parent satisfaction solidify its standing as a high-performing 'Blue Chip' entity.
Schools
Chaffey Joint Union High School District is a solid and stable high-performing organization, currently ranked as the premier district in San Bernardino County. With a portfolio of high schools that largely range from 6/10 to 9/10, the district demonstrates consistent academic success, particularly in English Language Arts and college readiness. While math proficiency remains a strategic area for growth and anecdotal reports suggest minor social-environment concerns on campus, the district's proactive leadership, diverse extracurricular offerings, and strong financial footing—highlighted by recent facility upgrades and successful community engagement initiatives—solidify its status as a top-tier educational provider.
Schools
Fontana Unified School District is a large, operationally active organization in transition, characterized by a significant performance gap between its premier academies and its struggling neighborhood schools. While the district earns high marks for its specialized Career Technical Education (CTE), dual immersion programs, and robust extracurriculars, it is hindered by low standardized test scores in middle school math and high staff turnover in special education. Recent investments in technology, campus security, and facility modernizations indicate a proactive administration and stable funding, yet the wide variance in school-level ratings (ranging from 1/10 to 10/10) prevents a higher overall designation, making it a 'Mixed/Transition' district.
Schools
Cucamonga Elementary School District is a distressed district characterized by significantly below-average academic proficiency and persistent operational challenges. Despite the district's commendable efforts in providing community support services and managing a diverse student population, ground truth metrics reveal a sharp decline in academic standing, with math and reading scores trailing state averages by nearly 50%. While safety measures and community programs remain active, the district's low school ratings (as low as 2/10), high chronic absenteeism, and the lack of top-performing schools indicate an organization struggling to meet state standards and retain community confidence when compared to neighboring high-performing districts.
Schools
School Insights for Eastside
Below average outcomes; significant attendance and academic challenges.
School Insights
See what's really behind every school rating near Eastside
- Individual school ratings — each school's own score with outcome context, not just a district average
- Enrollment & class size data — student-to-teacher ratio and how it compares to the state average
- Full demographics breakdown — ethnicity and gender composition for every school in the enrollment zone
- Every school in the district — all schools within the enrollment boundary ranked by rating, not just the closest one
- Grade levels & benchmarks — elementary through high school, with below/above state-average flags
No credit card required