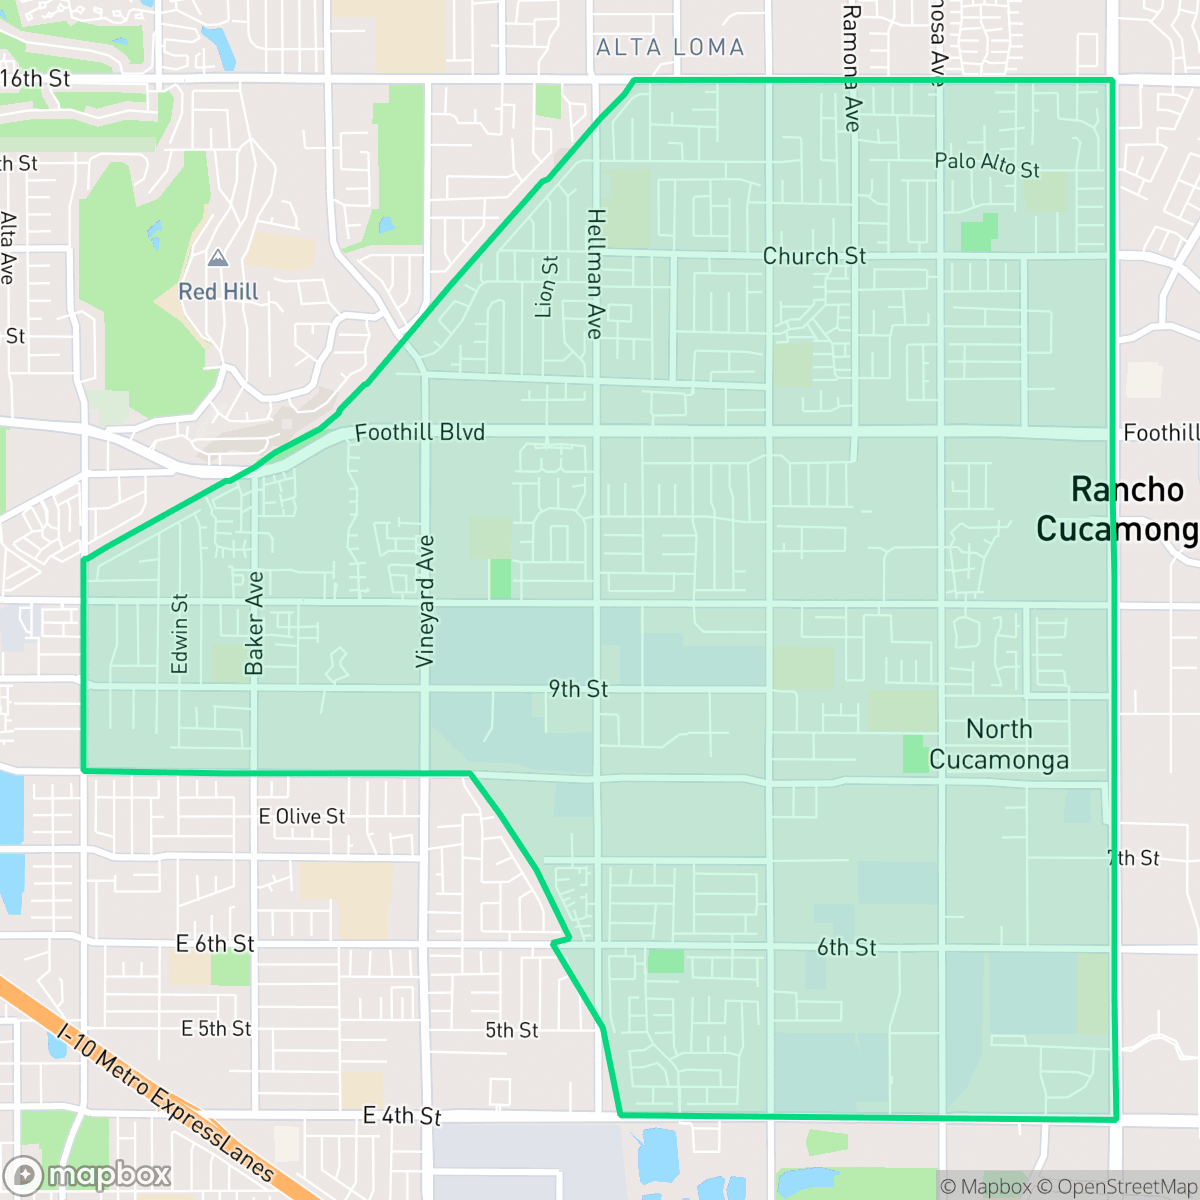
Cucamonga, Rancho Cucamonga
Updated June 22, 2026 · 45,059 residents
Cucamonga is a historically significant neighborhood defined by its deep roots in California viticulture and its position along the iconic Route 66. The area offers a highly walkable suburban environment, though residents experience a dense residential layout and frequent proximity to large-scale industrial logistics hubs.
Key Highlights
About Cucamonga
The Cucamonga neighborhood, one of three historic communities that incorporated to form Rancho Cucamonga in 1977, traces its roots to the 1839 Rancho Cucamonga Mexican land grant. Grantee Tiburcio Tapia built a fortified adobe on Red Hill and established the area's first vineyard. In 1860, subsequent owner John Rains constructed the brick John Rains House, now a historic landmark. The community expanded in the 1880s when the Cucamonga Company secured water rights via canyon irrigation tunnels. Renowned for its viticulture, Cucamonga became a major agricultural hub, later embracing its location along historic Route 66. Iconic neighborhood landmarks include the 1915 Cucamonga Service Station—now a Route 66 museum—and remnants of historic wineries, reflecting the area’s deep-seated agricultural and roadside heritage.
The neighborhood functions as a dense suburban landscape where residential grids meet significant industrial and commercial infrastructure. Residents enjoy a highly walkable environment with consistent sidewalk networks that connect local streets to diverse dining options and community spaces. The area maintains a balanced urban-rural feel, characterized by a mix of established single-family homes and multi-family apartment complexes. According to iHuus data, the area benefits from a robust pedestrian infrastructure that is well above the city average.
Prospective residents should consider the trade-offs associated with the local geography, including limited residential privacy due to closely spaced housing and elevated noise levels from nearby road traffic. While the area provides convenient access to local services, the presence of large logistics warehouses in the southern sectors introduces significant truck activity. This location is best suited for individuals who prioritize pedestrian accessibility and proximity to major transit corridors over absolute quiet or expansive private yards.
Neighborhood Scores Across 15 Qualities
Residential spacing varies between dense apartment clusters and suburban homes with small side yards. This level of privacy is slightly lower than the city average due to more frequent close proximity between structures.
Continuous sidewalk networks and clearly marked crosswalks are present on both residential and arterial streets, offering a level of walkability that is slightly above the city average. According to iHuus data, the neighborhood features integrated pedestrian paths and well-defined crossings at major intersections.
Residential views range from affluent pockets featuring large homes and private pools to more dense, uniform tract housing and apartment complexes. This visual variety is slightly below the Rancho Cucamonga average due to the prevalence of high-density multi-family units and mobile home parks.
Walking routes are supported by continuous sidewalks and various green verges, though access to large public parks is slightly below the Rancho Cucamonga average according to iHuus data.
Residential streets and apartment complexes sit alongside large-scale warehouse districts and logistics centers. This landscape is largely consistent with the broader city average, offering a blend of suburban living and heavy industrial infrastructure.
A mix of light industrial warehouses and suburban greenery creates a balanced but car-dependent atmosphere. This area offers more frequent dining and social options than the city average, though many services remain difficult to reach without a vehicle.
Ongoing traffic sounds from a nearby busy street are a common feature here; this level of noise is slightly higher than the average for the rest of the city.
Air quality in this area typically fluctuates between acceptable and unhealthy levels, presenting occasional concerns for sensitive groups. This level of atmospheric quality is consistent with the city average, according to iHuus data.
Large-scale logistics hubs and distribution centers with heavy truck activity are present in the southern and eastern portions of the area, though the neighborhood remains primarily residential compared to the city average.
Health insurance access is widespread among residents, performing at a level very similar to the Rancho Cucamonga average according to iHuus data.
Political leanings in this area lean liberal, representing a more progressive tilt than the average found throughout Rancho Cucamonga according to iHuus data.
Residents live alongside a diverse mix of young adults, families, and seniors. This demographic distribution is consistent with the broader Rancho Cucamonga area, according to iHuus data.
Property located within the 100-year floodplain may require mandatory flood insurance. According to iHuus data, the flood risk in this area is slightly higher than the Rancho Cucamonga average.
Block-Level Insights for Cucamonga

iHuus Neighborhood Intelligence Insights
Get block-level neighborhood insights for Cucamonga
- Street-level scores — see how individual blocks compare, not just neighborhood averages
- Micro-zone boundaries — identify quiet pockets, flood boundaries, and walkable clusters before you visit
- 15 dimensions in full — walkability, noise, air quality, school quality, insurance coverage, population age profile, urban/rural index, and more
- Boundary risk alerts — know if your address sits near a block boundary where scores drop, the kind of detail no listing will ever mention
- School insights — individual school ratings and insights, not just district-level data
- Compare before you commit — side-by-side data across neighborhoods, down to block precision
No credit card required
Compare with Any Neighborhood
| Dimension | Cucamonga | Central North |
|---|---|---|
| 🚶 Walkabilityavg 8.76 | ||
| 🔊 Acoustic Comfortavg 3.76 | ||
| 🤫 Privacy Indexavg 4.95 | ||
| 🎨 Visual Appealavg 7.01 | ||
| 🐕 Dog Friendlinessavg 6.09 | ||
| 🗺️ Urban-Rural Indexavg 6.71 | ||
| ✨ Neighborhood Vibeavg 3.87 | ||
| 🏥 Health Insurance Coverageavg 8.11 | ||
| 🌿 Air Qualityavg 6.02 | ||
| 🏭 Industrial Proximityavg 8.19 | ||
| 🌊 Flood Safetyavg 3.4 | ||
| 🗳️ Ideological Leanavg 5.31 | ||
| 👥 Population Age Profileavg 4.85 | ||
| 🔥 Fire Safetyavg 0.22 | ||
| 🏫 School Quality |
Cucamonga Rankings
School Districts Serving Cucamonga
Chaffey Joint Union High School District is a solid and stable high-performing organization, currently ranked as the premier district in San Bernardino County. With a portfolio of high schools that largely range from 6/10 to 9/10, the district demonstrates consistent academic success, particularly in English Language Arts and college readiness. While math proficiency remains a strategic area for growth and anecdotal reports suggest minor social-environment concerns on campus, the district's proactive leadership, diverse extracurricular offerings, and strong financial footing—highlighted by recent facility upgrades and successful community engagement initiatives—solidify its status as a top-tier educational provider.
Schools
Central Elementary School District (CESD) is a stable and operationally sound organization characterized by strong fiscal management, low teacher turnover, and high community engagement. While the district has successfully implemented a 'Science of Reading' curriculum and maintains high English Language Arts scores on state dashboards, the ground truth data reveals a stark performance disparity, with nearly half of the schools rated at 3/10. Despite these academic gaps between campuses, parental sentiment remains overwhelmingly positive regarding teacher accessibility and campus security. The district is currently in a solid transitional phase, prioritizing facility upgrades and staffing stability to manage growing enrollment and classroom density.
Schools
Ontario-Montclair School District is a stable, fiscally sound organization characterized by a distinct internal performance divide and a strong commitment to its majority-minority student population. While the district maintains a 'Positive Certification' for its finances and earns prestige through individual campus awards like the California Distinguished School honor, overall academic proficiency remains below state targets. Community sentiment is generally positive, buoyed by dedicated teaching staff and integrated social services, though administrative efficiency and significant achievement gaps between its top-tier and bottom-tier schools indicate a district in a steady but middle-of-the-pack transitional state.
Schools
Upland Unified School District is a 'Mixed/Transition' organization characterized by exceptional graduation outcomes and high-performing flagship schools (Upland High, Valencia Elementary) contrasted against severe underperformance in several junior high and elementary feeders. The district is aggressively addressing these disparities through its 'Vision 2030' strategic plan, which includes innovative middle-college models and program consolidations. While financial management is stable and English Language Arts performance is strong, the district faces persistent challenges in mathematics proficiency, chronic absenteeism, and campus culture divides. Its status as a top-tier athletic district and its success in narrowing minority achievement gaps provide a solid foundation, but the significant internal quality gap between its highest and lowest-rated schools prevents a higher stability rating.
Schools
Cucamonga Elementary School District is a distressed district characterized by significantly below-average academic proficiency and persistent operational challenges. Despite the district's commendable efforts in providing community support services and managing a diverse student population, ground truth metrics reveal a sharp decline in academic standing, with math and reading scores trailing state averages by nearly 50%. While safety measures and community programs remain active, the district's low school ratings (as low as 2/10), high chronic absenteeism, and the lack of top-performing schools indicate an organization struggling to meet state standards and retain community confidence when compared to neighboring high-performing districts.
Schools
School Insights for Cucamonga
Below average outcomes; significant attendance and academic challenges.
School Insights
See what's really behind every school rating near Cucamonga
- Individual school ratings — each school's own score with outcome context, not just a district average
- Enrollment & class size data — student-to-teacher ratio and how it compares to the state average
- Full demographics breakdown — ethnicity and gender composition for every school in the enrollment zone
- Every school in the district — all schools within the enrollment boundary ranked by rating, not just the closest one
- Grade levels & benchmarks — elementary through high school, with below/above state-average flags
No credit card required