Central South, Rancho Cucamonga
Updated · 5,370 residents
Central South serves as the primary civic and transit hub of Rancho Cucamonga, anchored by the Metrolink station and modern mixed-use developments. While the area offers convenient access to regional transportation and local amenities, it is defined by a landscape of large-scale commercial warehouses and significant industrial activity. Residents here experience a fast-paced environment characterized by high-volume traffic and limited privacy due to the dense industrial infrastructure.
Key Highlights
About Central South
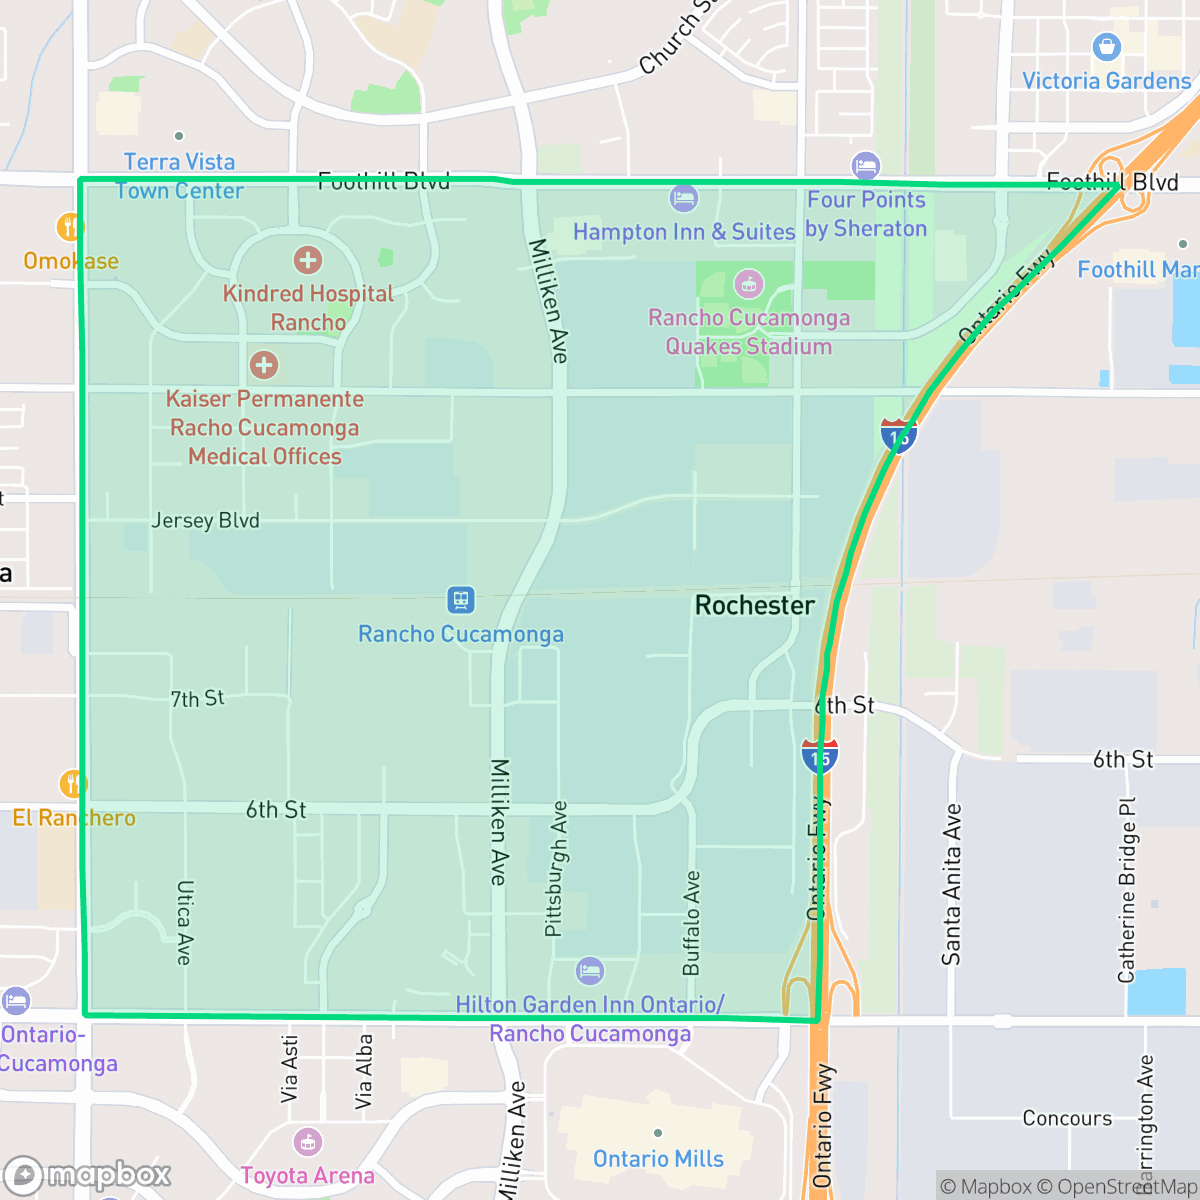
The Central South neighborhood of Rancho Cucamonga, historically designated as a broad "Industrial Area" in the city's 1980 General Plan, has undergone a major transformation from its agricultural and heavy industrial roots. Bordered by Foothill Boulevard to the north and Haven Avenue to the west, the area was historically characterized by vineyards and early 20th-century agricultural operations, including those connected to the nearby historic Virginia Dare Winery. Over the decades, specific plan amendments shifted the area toward business parks, offices, and light industrial use. Today, Central South serves as the civic and transit hub of the city, housing the Rancho Cucamonga Civic Center, the Epicenter sports complex, and the Cucamonga Metrolink Station. The neighborhood is transitioning into a modern, transit-oriented district, highlighted by "The Resort," a mixed-use residential development built on the former Empire Lakes Golf Course.
The area functions as a central nexus for the city, integrating critical transit infrastructure like the Cucamonga Metrolink Station with major civic landmarks such as the Rancho Cucamonga Civic Center and the Epicenter sports complex. Recent development efforts, including the conversion of former golf course land into residential communities, have introduced a residential layer to this historically industrial landscape. The neighborhood maintains a busy rhythm, supported by a variety of dining and lifestyle services interspersed among its commercial and logistics facilities.
Living in this district involves trade-offs between accessibility and environmental factors. According to iHuus data, the neighborhood features significant industrial proximity, which results in persistent noise from road traffic and logistics operations. While the area provides proximity to diverse retail and dining options, the prevalence of large-scale warehouses and heavy asphalt coverage creates a car-dependent environment. It is best suited for professionals and commuters who prioritize transit connectivity and proximity to major employment hubs over a quiet or highly walkable residential setting.
Neighborhood Scores Across 15 Qualities
Proximity to multi-family housing and narrow lot spacing can reduce individual privacy. According to iHuus data, this area offers less separation between neighbors than the typical Rancho Cucamonga residential block.
Sidewalks are well-defined along arterial roads and integrated into residential complexes, though overall walkability is slightly lower than the Rancho Cucamonga average.
Standard tract housing and high-density apartment complexes characterize the area, which offers slightly less visual variety than the Rancho Cucamonga average. Managed amenities like communal pools are common in the denser sections of the neighborhood, according to iHuus data.
Walking routes for pets are restricted by a lack of dedicated park access, falling below the Rancho Cucamonga average. While some sidewalks feature green verges and open lots, the area lacks the robust pet infrastructure found elsewhere in the city.
Large-scale warehouses and industrial logistics centers are interspersed with multi-family residential complexes. This landscape is slightly more developed than the typical surrounding areas in Rancho Cucamonga.
Diverse dining options and social hubs are more prevalent here than in the rest of the city, though the presence of industrial corridors and freight railways creates a mix of active pockets and quieter, car-dependent zones. According to iHuus data, residents can access a variety of amenities ranging from coffee shops to international cuisine, even as much of the area remains anchored by suburban and warehouse landscapes.
Frequent noise from nearby freeways and railroad tracks defines the acoustic environment here. According to iHuus data, levels of disturbance are notably higher than the Rancho Cucamonga average.
Air quality in this area fluctuates between acceptable and unhealthy levels, matching the typical conditions found throughout Rancho Cucamonga. Sensitive individuals should monitor local reports for days when air quality may cause concern.
Heavy logistics hubs and large warehouse complexes create more significant truck traffic and noise than is typical for the rest of Rancho Cucamonga. Residents may experience increased activity from semi-trucks and rail operations due to the proximity of major distribution centers and highway corridors.
Health insurance access is lower than the city average for Rancho Cucamonga. According to iHuus data, a significant portion of the population remains uninsured.
Political leanings in this area skew significantly more liberal than the Rancho Cucamonga average, according to iHuus data.
Residents live alongside a varied mix of young adults, families, and seniors. According to iHuus data, this demographic spread is slightly more concentrated toward certain age brackets than the typical Rancho Cucamonga profile.
Significant flood risk exists here due to the area's location within a 100-year floodplain, which is notably higher than the Rancho Cucamonga average. According to iHuus data, residents in this neighborhood will likely need to carry flood insurance.
Address-Level Insights for Central South


iHuus Neighborhood Intelligence Insights
Get address-level neighborhood insights for Central South
- Street-level scores — see how individual blocks compare, not just neighborhood averages
- Micro-zone boundaries — identify quiet pockets, flood boundaries, and walkable clusters before you visit
- 15 dimensions in full — walkability, noise, air quality, school quality, insurance coverage, population age profile, urban/rural index, and more
- Boundary risk alerts — know if your address sits near a block boundary where scores drop, the kind of detail no listing will ever mention
- School insights — individual school ratings and insights, not just district-level data
- Compare before you commit — side-by-side data across neighborhoods, down to block precision
No credit card required
Compare with Any Neighborhood
| Dimension | Central South | Central North |
|---|---|---|
| 🚶 Walkabilityavg 8.76 | ||
| 🔊 Acoustic Comfortavg 3.76 | ||
| 🤫 Privacy Indexavg 4.95 | ||
| 🎨 Visual Appealavg 7.01 | ||
| 🐕 Dog Friendlinessavg 6.09 | ||
| 🗺️ Urban-Rural Indexavg 6.71 | ||
| ✨ Neighborhood Vibeavg 3.87 | ||
| 🏥 Health Insurance Coverageavg 8.11 | ||
| 🌿 Air Qualityavg 6.02 | ||
| 🏭 Industrial Proximityavg 8.19 | ||
| 🌊 Flood Safetyavg 3.4 | ||
| 🗳️ Ideological Leanavg 5.31 | ||
| 👥 Population Age Profileavg 4.85 | ||
| 🔥 Fire Safetyavg 0.22 | ||
| 🏫 School Quality |
Central South Rankings
School Districts Serving Central South
School Insights for Central South
Below average outcomes; significant attendance and academic challenges.
School Insights
See what's really behind every school rating near Central South
- Individual school ratings — each school's own score with outcome context, not just a district average
- Enrollment & class size data — student-to-teacher ratio and how it compares to the state average
- Full demographics breakdown — ethnicity and gender composition for every school in the enrollment zone
- Every school in the district — all schools within the enrollment boundary ranked by rating, not just the closest one
- Grade levels & benchmarks — elementary through high school, with below/above state-average flags
No credit card required