Central North, Rancho Cucamonga
Updated · 47,993 residents
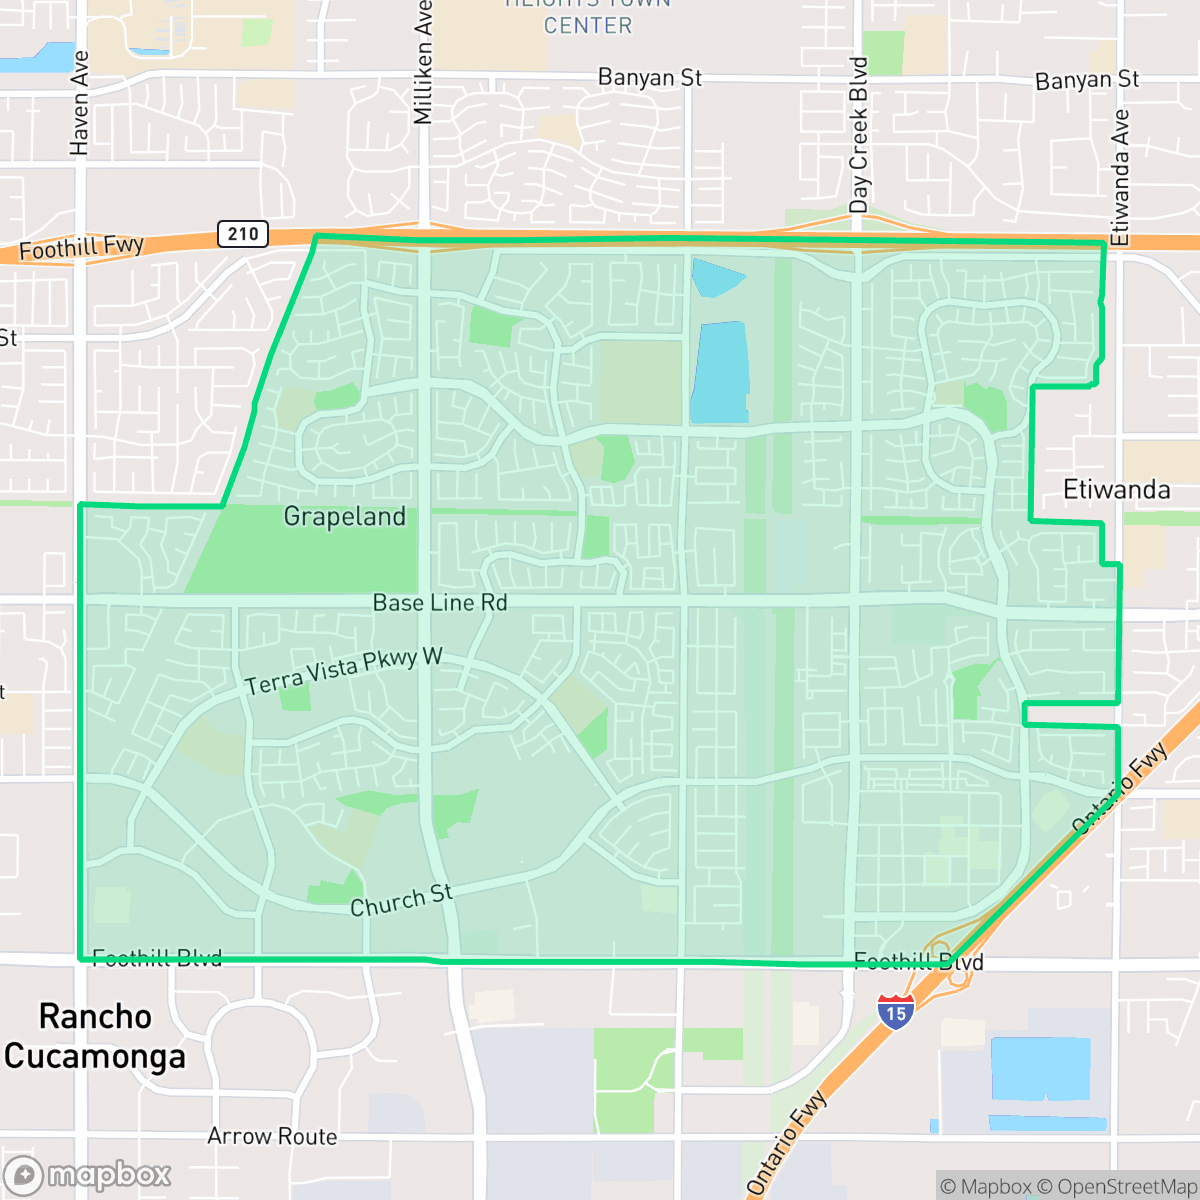
Central North is a dense, highly walkable suburban neighborhood in Rancho Cucamonga known for its affluent, well-maintained homes and proximity to top-rated schools. Residents enjoy a quiet atmosphere with extensive sidewalk networks and access to local parks, though the area features closely spaced housing and limited privacy.
Key Highlights
About Central North
Central North is an established suburban enclave characterized by its high density of single-family homes and multi-family units. The area is defined by its strong walkability, with continuous sidewalk networks and pedestrian-friendly cul-de-sacs that connect residents to community parks like Victoria Groves and Windrows Park. According to iHuus data, the neighborhood maintains a consistent visual appeal through uniform architectural styles, private backyard pools, and well-kept suburban infrastructure, while remaining free from heavy industrial hazards.
Potential residents should note the trade-offs inherent in this high-density environment, including limited distance between homes and moderate noise levels from local road traffic. While the area is quiet and residential, it is situated within a region that requires awareness of environmental risks such as fire and flood potential. The neighborhood is well-suited for families seeking access to high-performing schools within the Etiwanda Elementary School District and those who prioritize a pedestrian-oriented lifestyle over expansive private land.
Neighborhood Scores Across 15 Qualities
Residential spacing varies from closely packed tract homes to standard suburban lots, resulting in a privacy level that is roughly average for the city. According to iHuus data, some areas feature shared walls or narrow side yards, while other sections offer more significant buffers between neighbors.
Extensive sidewalk networks and well-marked crosswalks provide excellent connectivity for pedestrians, slightly surpassing the city average for ease of movement. While major arterial roads can occasionally divide certain pockets, the presence of continuous paths and low-traffic cul-de-sacs ensures a safe environment for walking.
Large homes with private backyard pools and multi-car driveways characterize much of this area. This level of visual appeal is consistent with the average found throughout Rancho Cucamonga.
Abundant green spaces, connected park systems, and wide sidewalks with grass verges provide excellent opportunities for pet owners. According to iHuus data, these walking options are more prevalent here than in the rest of the city.
A blend of dense suburban housing and commercial zones characterizes this area, which sits slightly less open than the typical Rancho Cucamonga landscape. Residents will find a variety of residential layouts ranging from single-family tracts to multi-family complexes alongside large-scale retail and industrial structures.
Local activity levels are slightly above the city average, characterized by a balance of quiet residential streets and accessible dining hubs. While some areas feature walkable pockets of services, much of the neighborhood remains a calm, car-oriented suburban environment.
Local traffic from nearby busy streets creates a consistent background noise level. This acoustic environment is slightly more active than the average for Rancho Cucamonga.
Air quality in this area fluctuates between acceptable and unhealthy levels, presenting occasional concerns for sensitive groups. This pattern is consistent with the average air quality levels found throughout Rancho Cucamonga.
Land use is almost exclusively residential and light commercial, with no detectable warehouses or industrial hazards. This area is significantly cleaner of heavy industrial presence than the Rancho Cucamonga average.
Most residents in this area have access to health insurance, which is slightly above the Rancho Cucamonga average according to iHuus data.
Political leanings in this area are relatively even, showing a slightly more diverse ideological split than the Rancho Cucamonga average according to iHuus data.
Residents live alongside a balanced mix of young adults, families, and older individuals. This demographic spread is largely consistent with the broader Rancho Cucamonga area according to iHuus data.
Properties in this area are situated within a designated floodplain, which may necessitate the purchase of flood insurance. According to iHuus data, this level of risk is consistent with the average found across Rancho Cucamonga.
Wildfire hazards in this area are severe and represent a higher risk level than the Rancho Cucamonga average. Residents should prioritize maximum fire protection measures and preparedness strategies according to iHuus data.
Address-Level Insights for Central North


iHuus Neighborhood Intelligence Insights
Get address-level neighborhood insights for Central North
- Street-level scores — see how individual blocks compare, not just neighborhood averages
- Micro-zone boundaries — identify quiet pockets, flood boundaries, and walkable clusters before you visit
- 15 dimensions in full — walkability, noise, air quality, school quality, insurance coverage, population age profile, urban/rural index, and more
- Boundary risk alerts — know if your address sits near a block boundary where scores drop, the kind of detail no listing will ever mention
- School insights — individual school ratings and insights, not just district-level data
- Compare before you commit — side-by-side data across neighborhoods, down to block precision
No credit card required
Compare with Any Neighborhood
| Dimension | Central North | Central South |
|---|---|---|
| 🚶 Walkabilityavg 8.76 | ||
| 🔊 Acoustic Comfortavg 3.76 | ||
| 🤫 Privacy Indexavg 4.95 | ||
| 🎨 Visual Appealavg 7.01 | ||
| 🐕 Dog Friendlinessavg 6.09 | ||
| 🗺️ Urban-Rural Indexavg 6.71 | ||
| ✨ Neighborhood Vibeavg 3.87 | ||
| 🏥 Health Insurance Coverageavg 8.11 | ||
| 🌿 Air Qualityavg 6.02 | ||
| 🏭 Industrial Proximityavg 8.19 | ||
| 🌊 Flood Safetyavg 3.4 | ||
| 🗳️ Ideological Leanavg 5.31 | ||
| 👥 Population Age Profileavg 4.85 | ||
| 🔥 Fire Safetyavg 0.22 | ||
| 🏫 School Quality |
Central North Rankings
School Districts Serving Central North
School Insights for Central North
Below average outcomes; significant attendance and academic challenges.
School Insights
See what's really behind every school rating near Central North
- Individual school ratings — each school's own score with outcome context, not just a district average
- Enrollment & class size data — student-to-teacher ratio and how it compares to the state average
- Full demographics breakdown — ethnicity and gender composition for every school in the enrollment zone
- Every school in the district — all schools within the enrollment boundary ranked by rating, not just the closest one
- Grade levels & benchmarks — elementary through high school, with below/above state-average flags
No credit card required