Prospect Park, Rancho Cordova
Updated · 1,123 residents
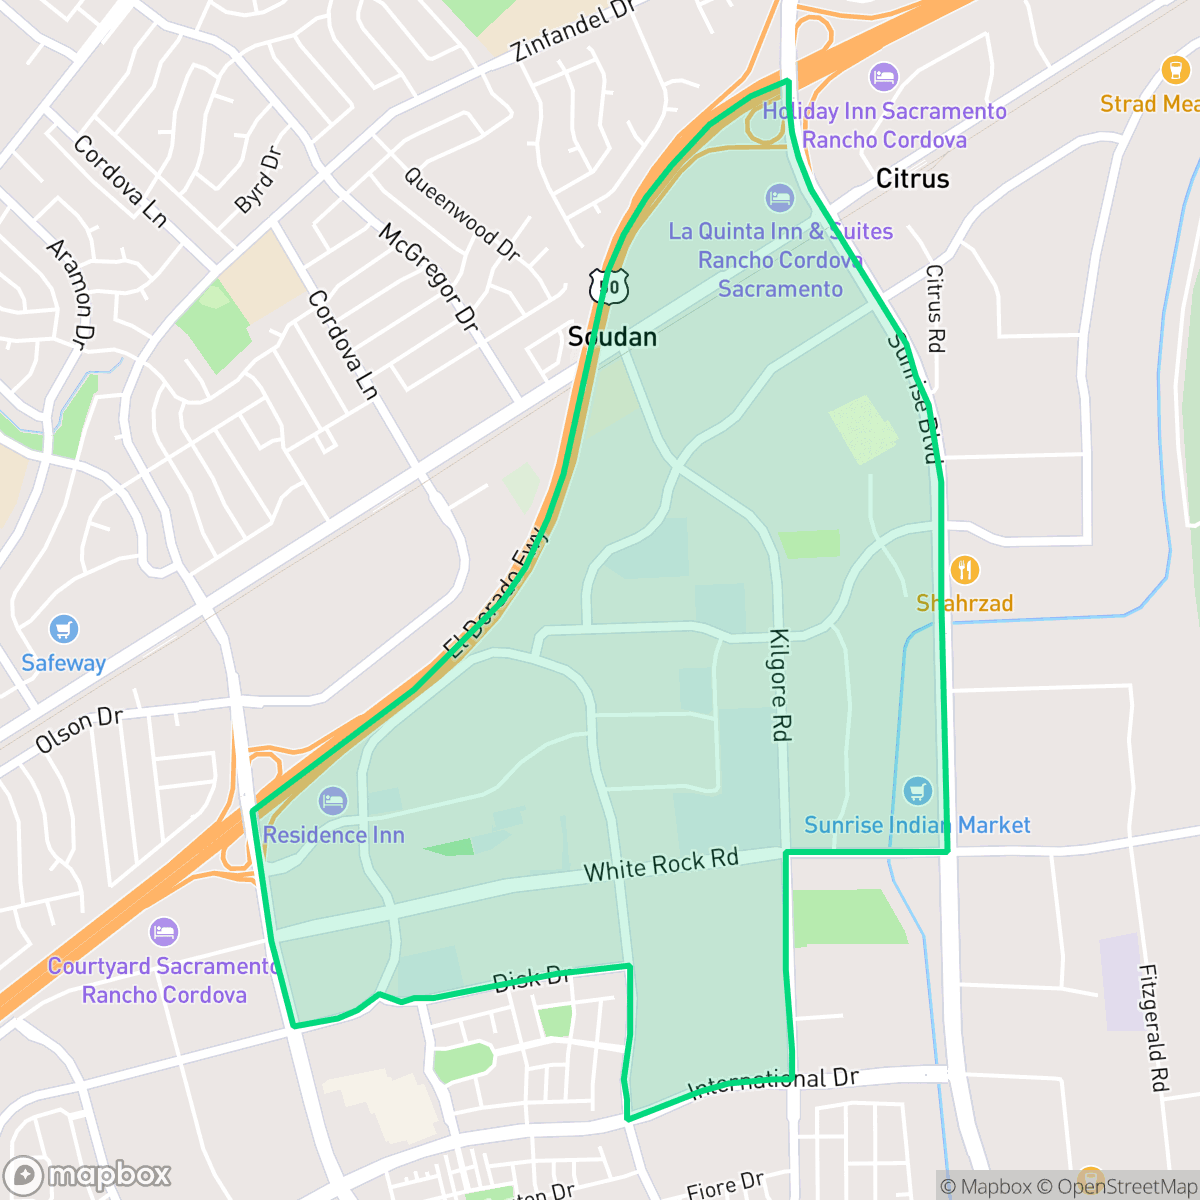
Prospect Park is a dense, car-dependent neighborhood in Rancho Cordova defined by its proximity to major logistics hubs and industrial corridors. While the area offers convenient access to local dining and the Sacramento Children's Museum, residents experience significant noise from nearby highway traffic and limited privacy.
Key Highlights
About Prospect Park
Prospect Park functions as a high-energy, mixed-use zone that blends residential life with active light industrial operations. Situated near major transit arteries, the area features a landscape dominated by large-scale warehouses and commercial infrastructure. Despite its industrial feel, the neighborhood maintains a distinct social pulse, hosting diverse amenities ranging from casual eateries like Jimboy's Tacos to family-oriented attractions such as the Sacramento Children's Museum.
Living here requires a reliance on personal vehicles, as the neighborhood's layout is not designed for pedestrians. Prospective residents should be aware of the high ambient noise levels, primarily driven by road traffic, as well as the environmental risks associated with local flood and fire zones. While the area provides excellent health insurance coverage and proximity to essential services, it is best suited for those who prioritize logistical convenience and access to regional transit over quiet, secluded suburban living.
Neighborhood Scores Across 15 Qualities
Houses are closely packed with small setbacks, offering less separation between neighbors than the Rancho Cordova average. According to iHuus data, this suburban density results in reduced buffer zones between adjacent properties.
Continuous sidewalks and low-traffic residential loops make much of the area accessible on foot, though the nearby highway acts as a significant barrier to movement. This level of walkability is consistent with the city average.
Standard tract housing with consistent rooflines and small yards characterizes the area. This landscape is slightly less varied than the Rancho Cordova average, according to iHuus data.
Wide paths and connected green spaces offer reliable walking options, though the area sits slightly below the Rancho Cordova average for pet-friendly infrastructure.
Open land and scattered homes provide a more semi-rural atmosphere than the denser urban patterns found elsewhere in Rancho Cordova. This landscape features a mix of single-family residential pockets alongside significant industrial and commercial zones.
Diverse dining options and social hubs provide a more active atmosphere than the typical Rancho Cordova area. While various restaurants and amenities are readily available, the neighborhood layout remains largely car-dependent.
Frequent noise from nearby railroad tracks and major freeway proximity characterizes this area. According to iHuus data, acoustic levels are significantly higher than the Rancho Cordova average.
Air quality in this area fluctuates between acceptable and unhealthy levels, matching the city average. Sensitive groups may experience occasional concern during certain periods according to iHuus data.
Light industrial and commercial structures exist alongside residential areas, resulting in lower industrial density than the Rancho Cordova average. Some portions of the neighborhood include large warehouses and logistics hubs near the southeast corner.
Health insurance accessibility is high in this area, trending above the Rancho Cordova average according to iHuus data.
Political leanings in this area are largely liberal, though the community displays a slightly more moderate profile than the Rancho Cordova average according to iHuus data.
Residents live alongside a balanced mix of young professionals, families, and seniors. This demographic variety is slightly more distributed than the average found throughout Rancho Cordova, according to iHuus data.
Flood risk in this area is slightly higher than the Rancho Cordova average. According to iHuus data, the specific risk level remains undetermined because detailed federal studies have not yet been completed for this part of the neighborhood.
Address-Level Insights for Prospect Park


iHuus Neighborhood Intelligence Insights
Get address-level neighborhood insights for Prospect Park
- Street-level scores — see how individual blocks compare, not just neighborhood averages
- Micro-zone boundaries — identify quiet pockets, flood boundaries, and walkable clusters before you visit
- 15 dimensions in full — walkability, noise, air quality, school quality, insurance coverage, population age profile, urban/rural index, and more
- Boundary risk alerts — know if your address sits near a block boundary where scores drop, the kind of detail no listing will ever mention
- School insights — individual school ratings and insights, not just district-level data
- Compare before you commit — side-by-side data across neighborhoods, down to block precision
No credit card required
Compare with Any Neighborhood
| Dimension | Prospect Park | Capital Village |
|---|---|---|
| 🚶 Walkabilityavg 8.57 | ||
| 🔊 Acoustic Comfortavg 3.27 | ||
| 🤫 Privacy Indexavg 5.44 | ||
| 🎨 Visual Appealavg 6.53 | ||
| 🐕 Dog Friendlinessavg 7.28 | ||
| 🗺️ Urban-Rural Indexavg 6.99 | ||
| ✨ Neighborhood Vibeavg 4.41 | ||
| 🏥 Health Insurance Coverageavg 8.03 | ||
| 🌿 Air Qualityavg 5.99 | ||
| 🏭 Industrial Proximityavg 7.66 | ||
| 🌊 Flood Safetyavg 6.4 | ||
| 🗳️ Ideological Leanavg 7.26 | ||
| 👥 Population Age Profileavg 4.84 | ||
| 🔥 Fire Safetyavg 0.44 | ||
| 🏫 School Quality |
Prospect Park Rankings
School Districts Serving Prospect Park
School Insights for Prospect Park
Below average outcomes; significant attendance and academic challenges.
School Insights
See what's really behind every school rating near Prospect Park
- Individual school ratings — each school's own score with outcome context, not just a district average
- Enrollment & class size data — student-to-teacher ratio and how it compares to the state average
- Full demographics breakdown — ethnicity and gender composition for every school in the enrollment zone
- Every school in the district — all schools within the enrollment boundary ranked by rating, not just the closest one
- Grade levels & benchmarks — elementary through high school, with below/above state-average flags
No credit card required