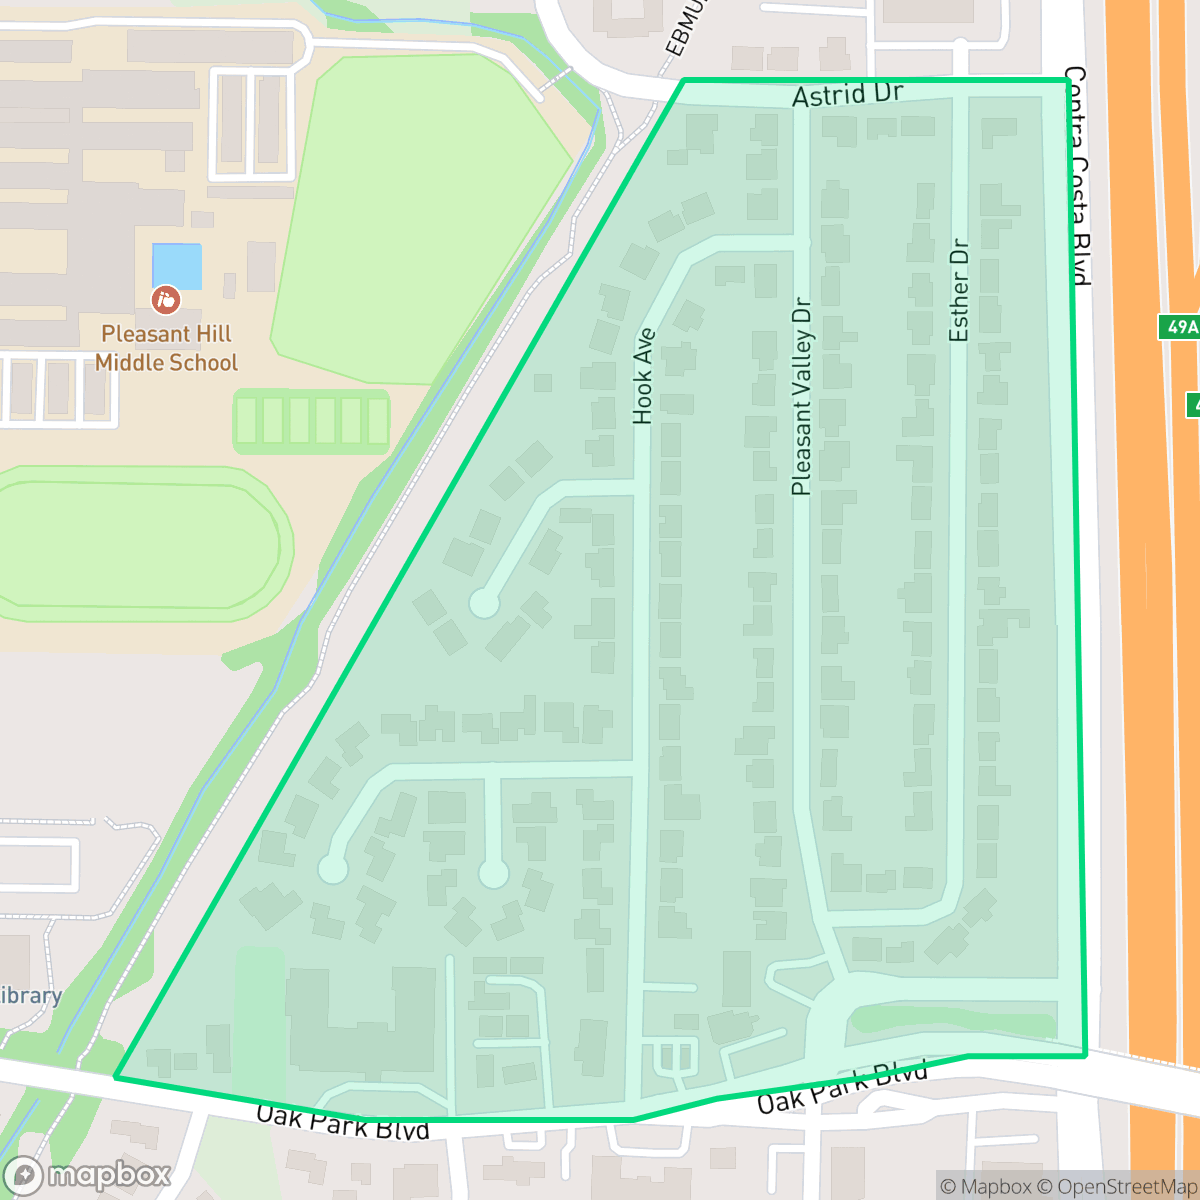
Pleasant Valley, Pleasant Hill
Updated June 22, 2026 · 451 residents
Pleasant Valley is a mixed-use neighborhood in Pleasant Hill characterized by its proximity to major transit corridors and a blend of residential and light industrial spaces. While the area offers high walkability and strong dog-friendly amenities, residents should note the significant noise levels from nearby road traffic and specific environmental risk factors.
Key Highlights
About Pleasant Valley
Pleasant Valley serves as a functional, mixed-use enclave within Pleasant Hill, balancing residential blocks with light industrial units and commercial hubs. The area maintains a distinct, lively suburban character that benefits from high walkability and a welcoming environment for dog owners. According to iHuus data, the neighborhood reflects a strong ideological consensus among its residents, contributing to a cohesive community feel despite its proximity to major highway infrastructure. Prospective residents should weigh the neighborhood's accessibility against notable environmental trade-offs. The area experiences high noise levels due to road traffic and carries significant risks related to flood and fire safety. Additionally, the local health insurance coverage rates are lower than the city average. This neighborhood is best suited for individuals who prioritize central location and transit access over absolute acoustic tranquility or high-tier environmental safety ratings.
Neighborhood Scores Across 15 Qualities
Residential spacing varies between detached homes with moderate buffers and denser apartment complexes with shared walls. According to iHuus data, this level of privacy is roughly consistent with the average found throughout Pleasant Hill.
Sidewalks and safe crossings are available on most streets, though a large highway serves as a significant barrier to movement. Walkability levels are slightly below the Pleasant Hill average according to iHuus data.
Large residential properties and private amenities like swimming pools characterize this area. According to iHuus data, the visual landscape is slightly below the Pleasant Hill average.
Residential streets and sidewalk verges offer safe walking routes, though the availability of connected green spaces is lower than the Pleasant Hill average. Local access to small parks and green buffers provides some opportunities for pet owners, according to iHuus data.
Open land and scattered greenery characterize this area, providing a slightly more natural landscape than the more developed city average. While some pockets feature dense suburban housing and commercial structures, many parts of the neighborhood maintain a transition toward woodland or field settings.
Lively blocks featuring a notable concentration of dining options and social hubs exist here, making the area more active than the Pleasant Hill average. While diverse eateries are present near the highway, many businesses require a short drive as they are not all within walking distance.
Frequent loud disturbances from nearby airport runways and heavy rail infrastructure characterize this area. Acoustic comfort is significantly lower than the average for Pleasant Hill, according to iHuus data.
Air quality remains mostly clean with rare instances of elevated readings, performing slightly above the Pleasant Hill average according to iHuus data.
Residential life remains undisturbed by heavy industry, as the area consists primarily of housing, office parks, and retail. While there is slight commercial activity, the presence of industrial zones is even lower than the Pleasant Hill average.
Health insurance access among residents is notably lower than the Pleasant Hill average, according to iHuus data.
Voting patterns and census indicators reflect a deeply liberal political leaning that is consistent with the rest of Pleasant Hill.
Residents live alongside a balanced mix of young adults, families, and older populations. This age distribution aligns with the broader demographic trends seen across Pleasant Hill.
Flood risk in this area is higher than the Pleasant Hill average, though current FEMA studies for this specific zone are not yet complete. Residents should exercise standard caution as the precise level of risk remains undetermined according to iHuus data.
Block-Level Insights for Pleasant Valley

iHuus Neighborhood Intelligence Insights
Get block-level neighborhood insights for Pleasant Valley
- Street-level scores — see how individual blocks compare, not just neighborhood averages
- Micro-zone boundaries — identify quiet pockets, flood boundaries, and walkable clusters before you visit
- 15 dimensions in full — walkability, noise, air quality, school quality, insurance coverage, population age profile, urban/rural index, and more
- Boundary risk alerts — know if your address sits near a block boundary where scores drop, the kind of detail no listing will ever mention
- School insights — individual school ratings and insights, not just district-level data
- Compare before you commit — side-by-side data across neighborhoods, down to block precision
No credit card required
Compare with Any Neighborhood
| Dimension | Pleasant Valley | Camelback |
|---|---|---|
| 🚶 Walkabilityavg 8.31 | ||
| 🔊 Acoustic Comfortavg 3.54 | ||
| 🤫 Privacy Indexavg 5.86 | ||
| 🎨 Visual Appealavg 7.45 | ||
| 🐕 Dog Friendlinessavg 7.68 | ||
| 🗺️ Urban-Rural Indexavg 6.97 | ||
| ✨ Neighborhood Vibeavg 5.16 | ||
| 🏥 Health Insurance Coverageavg 7.52 | ||
| 🌿 Air Qualityavg 7.92 | ||
| 🏭 Industrial Proximityavg 9.51 | ||
| 🌊 Flood Safetyavg 3.06 | ||
| 🗳️ Ideological Leanavg 9.51 | ||
| 👥 Population Age Profileavg 5.19 | ||
| 🔥 Fire Safetyavg 0.48 | ||
| 🏫 School Quality |
Pleasant Valley Rankings
School Districts Serving Pleasant Valley
MDUSD is a 'Mixed/Transition' district characterized by a deep divide between its high-achieving suburban campuses and its struggling urban schools. While the district maintains several California Distinguished Schools and high-performing high schools, it is currently grappling with a severe structural budget deficit, ten years of declining enrollment, and a significant maintenance backlog. The contrast between its elite 10/10 rated schools and its numerous 1/10 rated campuses suggests a lack of district-wide consistency. Despite strong diversity scores and collaborative labor relations, the looming 'fiscal cliff' and facility issues present significant risks to long-term operational health.
Schools
School Insights for Pleasant Valley
Below average outcomes; significant attendance and academic challenges.
School Insights
See what's really behind every school rating near Pleasant Valley
- Individual school ratings — each school's own score with outcome context, not just a district average
- Enrollment & class size data — student-to-teacher ratio and how it compares to the state average
- Full demographics breakdown — ethnicity and gender composition for every school in the enrollment zone
- Every school in the district — all schools within the enrollment boundary ranked by rating, not just the closest one
- Grade levels & benchmarks — elementary through high school, with below/above state-average flags
No credit card required