Ellinwood, Pleasant Hill
Updated June 22, 2026 · 412 residents
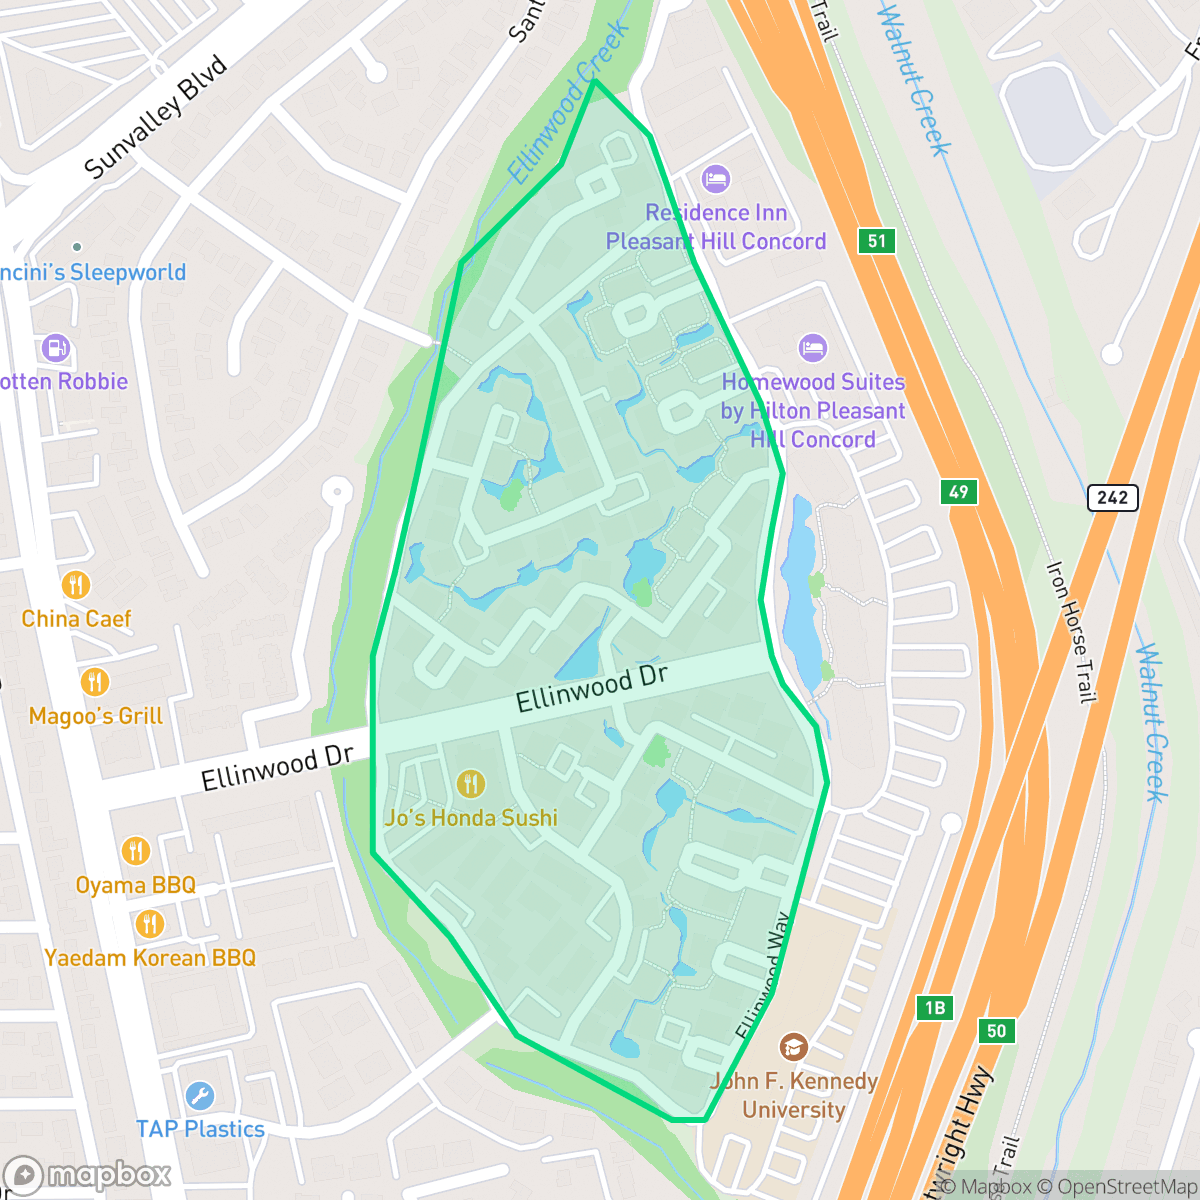
Ellinwood is a master-planned residential community defined by its central lake and proximity to major transit corridors. While the area offers established park spaces and a suburban layout, residents face significant road noise and specific challenges regarding fire and flood safety.
Key Highlights
About Ellinwood
The Ellinwood neighborhood in Pleasant Hill, California, originated as an 82-acre ranch purchased in 1912 by San Francisco physician Dr. Lathrop Ellinwood. Operating for decades as a working farm cultivating lettuce, cabbages, and fruit trees, the family-owned property remained intact because Dr. Ellinwood refused to sell the land during his lifetime. In 1977, the San Francisco development firm Gerson Bakar & Associates acquired the ranch. The firm transformed the agricultural tract into a master-planned residential community featuring single-family homes, townhouses, and the Ellinwood Apartments (built in 1984). Today, the neighborhood's modern suburban layout is centered around a signature four-acre man-made lake and the scenic walking trails of Ellinwood Park.
The neighborhood functions as a distinct residential enclave within Pleasant Hill, characterized by a mix of single-family homes and apartment living. The landscape is anchored by a signature lake and dedicated park space, which serve as the primary recreational focal points for the community. Its location provides efficient access to major regional thoroughfares, though this proximity results in elevated ambient noise levels from consistent road traffic. The area maintains a suburban atmosphere that balances residential life with pockets of commercial activity, including nearby wellness and industrial services.
According to iHuus data, the neighborhood presents specific trade-offs for prospective residents. While the area offers a consistent community aesthetic, it records lower walkability scores compared to the broader Pleasant Hill region, necessitating vehicle use for most daily errands. Furthermore, the local school district, Mount Diablo Unified, faces ongoing fiscal and infrastructure challenges that may impact long-term educational stability. The area is best suited for individuals who prioritize proximity to major commuting routes and established park amenities over low-noise environments or high-density walkability.
Neighborhood Scores Across 15 Qualities
Residential structures feature mixed spacing with some buffers between neighbors; this level of density is roughly consistent with the Pleasant Hill average according to iHuus data.
Developed sidewalk networks and clear pedestrian crossings make navigating the area on foot easy. This level of accessibility is consistent with the average found throughout Pleasant Hill.
Typical tract housing and multi-family units define the landscape, which features smaller yards and boxy rooflines. According to iHuus data, the visual variety in this area is lower than the Pleasant Hill average.
Fenced private yards and sidewalk verges provide safe walking conditions, though access to connected green spaces is slightly below the Pleasant Hill average according to iHuus data.
Residential areas feature a mix of single-family homes and apartment complexes, presenting a slightly less open landscape than the Pleasant Hill average. This layout offers a more traditional suburban feel compared to the more semi-rural patches found elsewhere in the city.
Social hubs and diverse dining options create a more energetic atmosphere than the typical Pleasant Hill neighborhood. While some areas near the highway feature light industrial units, many blocks offer a balanced mix of green spaces and local eateries.
Frequent loud disturbances from nearby airport runways and heavy rail infrastructure are present. This level of acoustic disruption is significantly higher than the average found across Pleasant Hill.
Air quality remains consistently high with infrequent periods of poor ventilation. This level of cleanliness is slightly above the Pleasant Hill average, according to iHuus data.
Industrial facilities and warehouses are absent from this area, which maintains a level of tranquility very similar to the rest of Pleasant Hill. According to iHuus data, the neighborhood consists of purely residential and commercial zones with no detectable industrial hazards.
Health insurance enrollment in this area is below the Pleasant Hill average, according to iHuus data. Residents may find fewer neighbors with active coverage compared to the rest of the city.
Voting patterns and census indicators reflect a predominantly liberal political leaning that is slightly more pronounced than the Pleasant Hill average.
Residents live alongside a diverse mix of young adults, families, and older individuals; this demographic spread is largely in line with the average across Pleasant Hill.
Property within this area is located inside a 100 year floodplain, which may necessitate flood insurance. According to iHuus data, this risk level is slightly higher than the average for Pleasant Hill.
Block-Level Insights for Ellinwood

iHuus Neighborhood Intelligence Insights
Get block-level neighborhood insights for Ellinwood
- Street-level scores — see how individual blocks compare, not just neighborhood averages
- Micro-zone boundaries — identify quiet pockets, flood boundaries, and walkable clusters before you visit
- 15 dimensions in full — walkability, noise, air quality, school quality, insurance coverage, population age profile, urban/rural index, and more
- Boundary risk alerts — know if your address sits near a block boundary where scores drop, the kind of detail no listing will ever mention
- School insights — individual school ratings and insights, not just district-level data
- Compare before you commit — side-by-side data across neighborhoods, down to block precision
No credit card required
Compare with Any Neighborhood
| Dimension | Ellinwood | Camelback |
|---|---|---|
| 🚶 Walkabilityavg 8.31 | ||
| 🔊 Acoustic Comfortavg 3.54 | ||
| 🤫 Privacy Indexavg 5.86 | ||
| 🎨 Visual Appealavg 7.45 | ||
| 🐕 Dog Friendlinessavg 7.68 | ||
| 🗺️ Urban-Rural Indexavg 6.97 | ||
| ✨ Neighborhood Vibeavg 5.16 | ||
| 🏥 Health Insurance Coverageavg 7.52 | ||
| 🌿 Air Qualityavg 7.92 | ||
| 🏭 Industrial Proximityavg 9.51 | ||
| 🌊 Flood Safetyavg 3.06 | ||
| 🗳️ Ideological Leanavg 9.51 | ||
| 👥 Population Age Profileavg 5.19 | ||
| 🔥 Fire Safetyavg 0.48 | ||
| 🏫 School Quality |
Ellinwood Rankings
School Districts Serving Ellinwood
MDUSD is a 'Mixed/Transition' district characterized by a deep divide between its high-achieving suburban campuses and its struggling urban schools. While the district maintains several California Distinguished Schools and high-performing high schools, it is currently grappling with a severe structural budget deficit, ten years of declining enrollment, and a significant maintenance backlog. The contrast between its elite 10/10 rated schools and its numerous 1/10 rated campuses suggests a lack of district-wide consistency. Despite strong diversity scores and collaborative labor relations, the looming 'fiscal cliff' and facility issues present significant risks to long-term operational health.
Schools
School Insights for Ellinwood
Below average outcomes; significant attendance and academic challenges.
School Insights
See what's really behind every school rating near Ellinwood
- Individual school ratings — each school's own score with outcome context, not just a district average
- Enrollment & class size data — student-to-teacher ratio and how it compares to the state average
- Full demographics breakdown — ethnicity and gender composition for every school in the enrollment zone
- Every school in the district — all schools within the enrollment boundary ranked by rating, not just the closest one
- Grade levels & benchmarks — elementary through high school, with below/above state-average flags
No credit card required