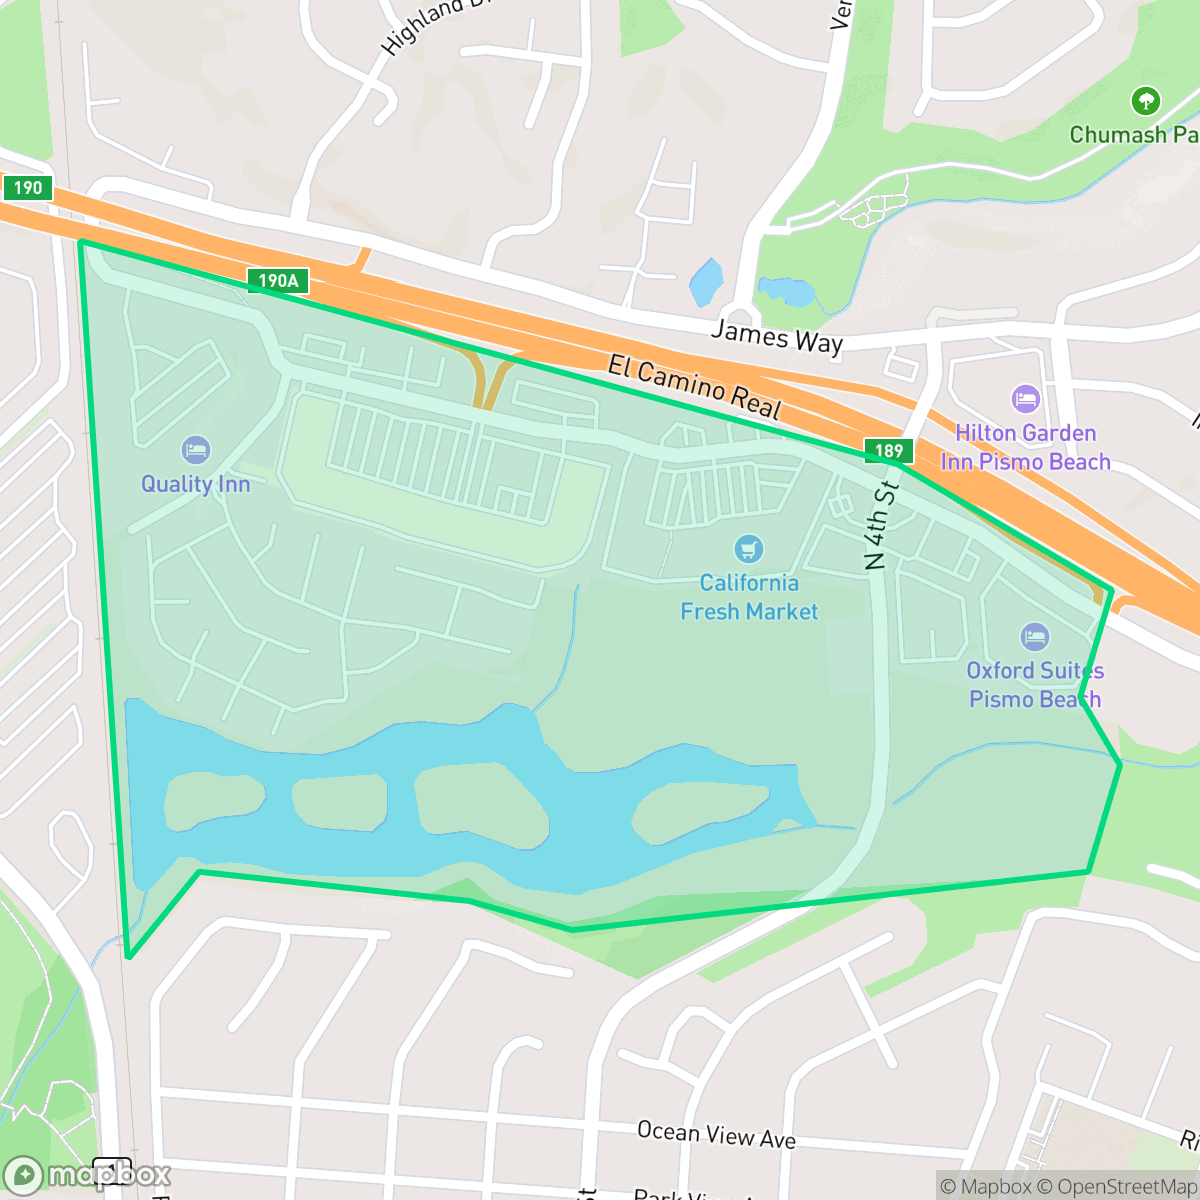
Pismo Marsh, Pismo Beach
Updated June 22, 2026 · 447 residents
Pismo Marsh is a compact, highly walkable neighborhood in Pismo Beach characterized by its proximity to major transit corridors and convenient access to local dining. While the area offers exceptional dog friendliness and clean air, residents should be prepared for significant noise levels due to its location near a major highway.
Key Highlights
About Pismo Marsh
Pismo Marsh serves as a distinct residential pocket within Pismo Beach, defined by its blend of suburban convenience and environmental accessibility. The neighborhood features a mix of residential blocks and nearby commercial amenities, including various eateries and coffee shops. With a perfect score for walkability and dog friendliness, it is well-suited for active residents who prioritize easy access to daily errands and outdoor exercise over absolute acoustic tranquility. The area maintains a consistent, suburban atmosphere with open green spaces that provide a buffer between the residential streets and the surrounding transit infrastructure.
Prospective residents should weigh the benefits of the neighborhood's central location against its primary trade-offs. The area experiences notable noise from nearby highway traffic, and, according to data, it faces challenges regarding flood and fire safety risks. While the neighborhood lacks the visual seclusion found in other parts of the city, its high walkability and proximity to essential services make it a practical choice for those who value connectivity. It remains a functional option for individuals or families who are comfortable with a higher-density suburban environment and the realities of living near major regional thoroughfares.
Neighborhood Scores Across 15 Qualities
Residential spacing is mixed with some buffers between neighbors, providing slightly more seclusion than the typical Pismo Beach neighborhood according to iHuus data.
Pedestrian travel is easy due to safe crossings and sidewalks present on one side of the street. This level of accessibility is above the Pismo Beach average, according to iHuus data.
Upscale amenities and large homes are present, but the overall aesthetic is slightly below the Pismo Beach average. Residential layouts feature spacious driveways and well-maintained properties according to iHuus data.
Connected green spaces and wide, traffic-safe paths make this area more dog-friendly than the Pismo Beach average, according to iHuus data.
Open land and scattered residential pockets provide a more tranquil setting than the more densely developed areas of Pismo Beach. According to iHuus data, this neighborhood features a mix of single-family homes and high-density mobile home parks nestled among fields and woodland.
A mix of industrial and suburban elements defines the area, providing a selection of dining and amenities that is slightly more active than the Pismo Beach average. While various social hubs and restaurants are accessible, much of the commercial activity is situated near major transit corridors rather than within a concentrated walkable center.
Frequent aircraft noise from the nearby airport runway significantly impacts acoustic comfort. This level of disturbance is much higher than the average found throughout Pismo Beach, according to iHuus data.
Air quality remains consistently high with negligible health concerns. This level of air purity is on par with the rest of Pismo Beach, according to iHuus data.
Residential streets and open green spaces define the area, though a wastewater treatment plant is located near the baseball fields. According to iHuus data, the presence of light commercial activity and utility infrastructure makes this area slightly more industrial than the Pismo Beach average.
Health insurance access in this area is notably lower than the Pismo Beach average. According to iHuus data, fewer residents in this neighborhood possess health coverage compared to the rest of the city.
Political perspectives in this area are divided almost evenly between conservative and liberal leanings, representing a distribution very similar to the broader Pismo Beach area according to iHuus data.
Older adults comprise the majority of the population here, representing a slightly higher proportion of seniors than the Pismo Beach average according to iHuus data.
Flood risk is significant in this area due to its location within a designated floodplain; according to iHuus data, this vulnerability is notably higher than the average found across Pismo Beach.
Extreme fire hazards characterize this area, presenting a significantly higher danger level than the rest of Pismo Beach. According to iHuus data, residents must prioritize maximum protection measures due to this heightened vulnerability.
Block-Level Insights for Pismo Marsh

iHuus Neighborhood Intelligence Insights
Get block-level neighborhood insights for Pismo Marsh
- Street-level scores — see how individual blocks compare, not just neighborhood averages
- Micro-zone boundaries — identify quiet pockets, flood boundaries, and walkable clusters before you visit
- 15 dimensions in full — walkability, noise, air quality, school quality, insurance coverage, population age profile, urban/rural index, and more
- Boundary risk alerts — know if your address sits near a block boundary where scores drop, the kind of detail no listing will ever mention
- School insights — individual school ratings and insights, not just district-level data
- Compare before you commit — side-by-side data across neighborhoods, down to block precision
No credit card required
Compare with Any Neighborhood
| Dimension | Pismo Marsh | Pacific Estates |
|---|---|---|
| 🚶 Walkabilityavg 8.02 | ||
| 🔊 Acoustic Comfortavg 2.35 | ||
| 🤫 Privacy Indexavg 5.38 | ||
| 🎨 Visual Appealavg 7.17 | ||
| 🐕 Dog Friendlinessavg 8.11 | ||
| 🗺️ Urban-Rural Indexavg 7.16 | ||
| ✨ Neighborhood Vibeavg 5.55 | ||
| 🏥 Health Insurance Coverageavg 7.57 | ||
| 🌿 Air Qualityavg 9.98 | ||
| 🏭 Industrial Proximityavg 8.79 | ||
| 🌊 Flood Safetyavg 4.67 | ||
| 🗳️ Ideological Leanavg 4.87 | ||
| 👥 Population Age Profileavg 5.92 | ||
| 🔥 Fire Safetyavg 0.98 | ||
| 🏫 School Quality |
Pismo Marsh Rankings
School Districts Serving Pismo Marsh
Lucia Mar Unified School District presents a tale of two districts, characterized by prestigious coastal elementary schools and high-achieving athletic programs at Arroyo Grande High, offset by significant academic underperformance at Nipomo High and several inland campuses. While the district maintains strong graduation rates and robust reserves, it is currently hindered by 'Mixed' operational health due to a prolonged and public labor dispute with its teachers' association. Despite modern security upgrades and successful resistance to book bans, the sharp disparity in school ratings and the friction between the administration and faculty suggest a period of transition and internal instability that prevents a 'Solid' rating.
Schools
School Insights for Pismo Marsh
Below average outcomes; significant attendance and academic challenges.
School Insights
See what's really behind every school rating near Pismo Marsh
- Individual school ratings — each school's own score with outcome context, not just a district average
- Enrollment & class size data — student-to-teacher ratio and how it compares to the state average
- Full demographics breakdown — ethnicity and gender composition for every school in the enrollment zone
- Every school in the district — all schools within the enrollment boundary ranked by rating, not just the closest one
- Grade levels & benchmarks — elementary through high school, with below/above state-average flags
No credit card required